Island Real Estate Trends and September 2024 Market Outlook

September is always an exciting time in the real estate market—what I like to call the “second spring.” After a summer of market fluctuations, we often see a surge of activity as both buyers and sellers aim to finalize their moves before winter sets in. This is a key month to pay attention to as trends solidify and the year's direction becomes clearer.
If you are interested in learning what the market conditions are for your home, drop me an email and we can arrange for a conversation about your needs. Replies to this weekly email come directly to my personal inbox and I read and reply to every email I receive. I pride myself on my clients having direct contact and access to me.
John Cooper
250.619.9207
john@johncooper.ca
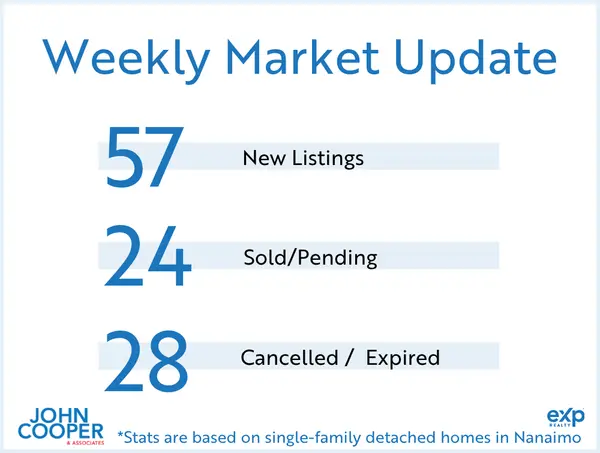
September 2024 Nanaimo Market Update

Most Recent Market Statistics (August 2024)*
Vancouver Island (not including Victoria)
333 single-family homes sold. Average price: $815,240 (up 4% from 12 months to date, this year over last). Single-family unit sales volume is down 8%. Average days on market decreased by 2% to 45 days. The average condo sold for $420,731. Condo unit sales are up 4%, 12 months to date. Condos have seen an increase by 4% in days on market. Average days to sell is 50 days. The average row/townhouse sold for $587,038. Row/townhouse unit sales are up 10%, 12 months to date. Row/townhouses have seen an increase by 13% in days on market. Average days to sell is 51 days. Lot sales volume is down 5%. Lot prices have increased by 7%, 12 months to date. Average lot sale price: $465,286. FULL REPORT HERE.
Nanaimo
84 single-family homes sold. Average price: $833,390 (up 3% from 12 months to date, this year over last). Single-family unit sales volume is down 2%. Average days on market decreased by 3% to 36 days. The average condo sold for $444,840. Condo unit sales are up 12%, 12 months to date. Condos have seen an increase by 5% in days on market. Average days to sell is 42 days. The average row/townhouse sold for $578,720. Row/townhouse unit sales are up 10%, 12 months to date. Row/townhouses have seen an increase by 10% in days on market. Average days to sell is 43 days. Lot sales volume is up 13%. Lot prices have increased by 21%, 12 months to date. Average lot sale price: $567,842. FULL REPORT HERE.
Parksville/Qualicum
50 single-family homes sold. Average price: $972,995 (up 5% from 12 months to date, this year over last). Single-family unit sales volume is down 5%. Average days on market decreased by 5% to 38 days. The average condo sold for $463,802. Condo unit sales are up 8%, 12 months to date. Condos have seen an increase by 31% in days on market. Average days to sell is 51 days. The average row/townhouse sold for $657,995. Row/townhouse unit sales are up 16%, 12 months to date. Row/townhouses have seen an increase by 14% in days on market. Average days to sell is 41 days. Lot sales volume is up 38%. Lot prices have decreased by 17%, 12 months to date. Average lot sale price: $543,977. FULL REPORT HERE.
Cowichan Valley
58 single-family homes sold. Average price: $801,284 (up 3% from 12 months to date, this year over last). Single-family unit sales volume is down 14%. Average days on market decreased by 6% to 45 days. The average condo sold for $353,191. Condo unit sales are up 3%, 12 months to date. Condos have seen a decrease by 20% in days on market. Average days to sell is 44 days. The average row/townhouse sold for $575,175. Row/townhouse unit sales are down 8%, 12 months to date. Row/townhouses have seen an increase by 29% in days on market. Average days to sell is 63 days. Lot sales volume is down 1%. Lot prices have increased by 10%, 12 months to date. Average lot sale price: $447,857. FULL REPORT HERE.
Categories
Recent Posts