October 2026 Newsletter

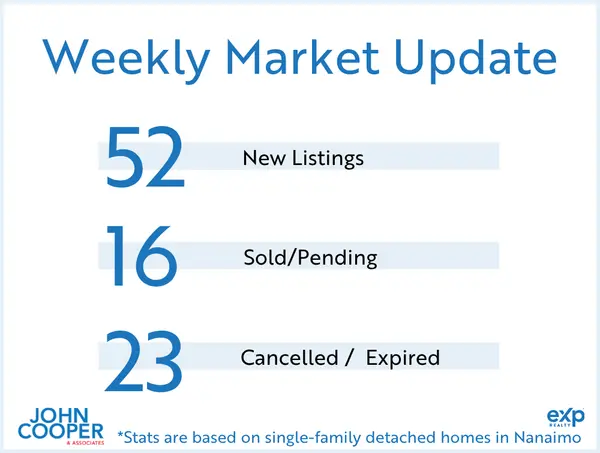
Key Takeaways from the October Week 1 Data
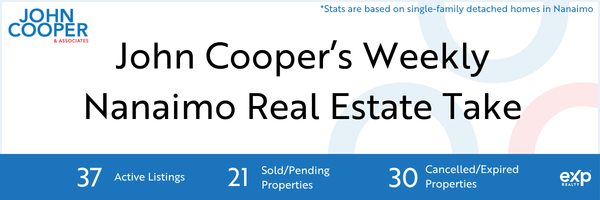
Sales Jump to a Fall High (21 Units): Buyers locked in 21 deals this week, breaking out of the 17-sale baseline that held firm through late September. This represents the strongest single sales week since mid-September.
New Supply Slows to 37 Listings: Fresh inventory pulled back to 37 listings, down from 42 last week. As we enter October, sellers are becoming more selective with their timing, leading to a tighter intake of brand-new choices.
Absorption Rebounds to 56.8%: With fewer incoming listings and an uptick in transaction velocity, the weekly absorption rate jumped over 16 percentage points to 56.8%. Fresh, well-priced homes are turning over at an accelerated pace.
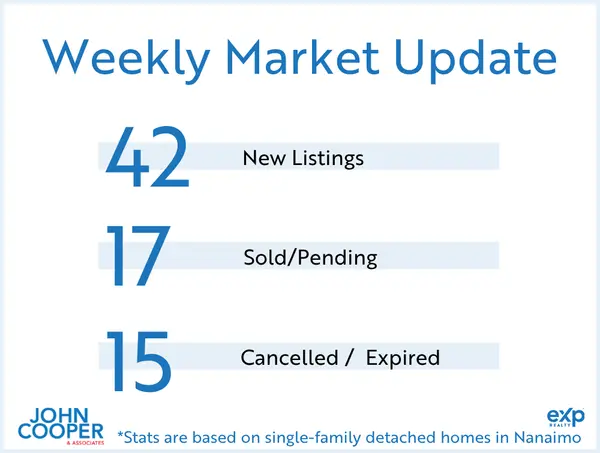
Failed and expired listings doubled from last week's 15 up to 30. This spike reflects a classic start-of-month and post-Q3 listing cleanup, where properties that failed to find buyers during the September push reached contract expiry or were delisted.
Synopsis for a Nanaimo Homeowner Planning Their Next Move
The first week of October illustrates a sharp "two-track" market as we transition into Q4: turn-key homes entering the market at realistic prices are selling rapidly, while lingering, overpriced properties are being forced into delisting.
For Sellers:
The surge to 21 sales proves that fall demand remains lively. However, with 30 failed listings hitting the books this week, the market is sending a clear message: buyers are paying top dollar only for homes priced strictly against recent fall comps. If you plan to launch before the late-autumn lull, entering with precise, realistic pricing gives you the best chance to capitalize on the current 56.8% absorption velocity.
For Buyers:
Fresh options slowed down to 37 listings, and competition for well-presented homes has tightened slightly. However, the surge in 30 cancelled and expired listings creates a valuable secondary market. Many of these delisted sellers are motivated to finalize a deal before year-end and may be far more receptive to subject-heavy offers, flexible closing timelines, or direct price renegotiations.

Most Recent Market Statistics (September 2026)*
Vancouver Island (not including Victoria)
279 single-family homes sold. Average price: $831,516 (up 1% from 12 months to date, this year over last). Single-family unit sales volume is down 8%. Average days on market stayed at 50 days. The average condo sold for $411,781. Condo unit sales are down 9%, 12 months to date. Condos have seen a increase of 8% in days on market. Average days to sell is 66 days. The average row/townhouse sold for $579,964. Row/townhouse unit sales are down 5%, 12 months to date. Row/townhouses have seen an increase of 13% in days on market. Average days to sell is 62 days. Lot sales volume is down 9%. Lot prices have increased by 6%, 12 months to date. Average lot sale price: $495,150.
Nanaimo
92 single-family homes sold. Average price: $847,644 (down .5% from 12 months to date, this year over last). Single-family unit sales volume is down 2%. Average days on market stayed the same at 42 days. The average condo sold for $430,955. Condo unit sales are down 14.5%, 12 months to date. Condos have seen a increase of 14% in days on market. Average days to sell is 57 days. The average row/townhouse sold for $554,364. Row/townhouse unit sales are decreased by 12%, 12 months to date. Row/townhouses have seen an increase of 36% in days on market. Average days to sell is 53 days. Lot sales volume is down 22%. Lot prices have decreased by 14%, 12 months to date. Average lot sale price: $469,333.
Parksville/Qualicum
41 single-family homes sold. Average price: $958,659 (up 1% from 12 months to date, this year over last). Single-family unit sales volume is down 11%. Average days on market increased by 2.5% to 42 days. The average condo sold for $444,609. Condo unit sales have increased by 30%, 12 months to date. Condos have seen an increased of 36% in days on market. Average days to sell is 64 days. The average row/townhouse sold for $671,853. Row/townhouse unit sales are down 5%, 12 months to date. Row/townhouses have seen a increase of 7.5% in days on market. Average days to sell is 57 days. Lot sales volume is up 38.5%. Lot prices have increased by 7.5%, 12 months to date. Average lot sale price: $575,760.
Cowichan Valley
46 single-family homes sold. Average price: $829,945 (up 3% from 12 months to date, this year over last). Single-family unit sales volume is down 11%. Average days on market decreased by 6% to 49 days. The average condo sold for $347,021. Condo unit sales are down 3%, 12 months to date. Condos have seen an increase of 10% in days on market. Average days to sell is 65 days. The average row/townhouse sold for $579,188. Row/townhouse unit sales have increased 3%, 12 months to date. Row/townhouses have seen a increased by 13% in days on market. Average days to sell is 70 days. Lot sales volume is down 18%. Lot prices have increased by 22%, 12 months to date. Average lot sale price: $559,118.
Notable New Listings
I like to start by outlining the best value based on $/sqft. The 3 best value homes listed this week are 695 Franklyn St a 5 bed, 4 bath, 3,646 sqft Old City home listed for $689,000 ($189/sqft), 61 View St a 4 bed, 2 bath, 1,940 sqft South Nanaimo home listed for $499,000 ($257/sqft), 648 Alyssa Pl a 7 bed, 4 bath, 2,653 sqft University District home listed for $799,900 ($302/sqft).
The 3 homes listed this week with the highest $/sqft are 2885 Shady Mile Way a 4 bed, 4 bath, 3,059 sqft North Jingle Pot home listed for $1,999,000 ($653/sqft), 660 Albert St a 1 bed, 1 bath, 546 sqft Old City home listed for $349,900 ($641/sqft), 2734 Yellow Point Rd a 4 bed, 2 bath, 2,007 sqft Cedar home listed for $1,229,000 ($612/sqft).
The 3 homes priced the most below their assessed value are 1491 Sherwood Dr a 3 bed, 2 bath, 2,574 sqft Departure Bay home listed for $799,900 (12% below its tax-assessed value), 5213 Fillinger Cres a 3 bed, 4 bath, 2,656 sqft North Nanaimo home listed for $925000 (10% below its tax-assessed value), 5848 Linyard Rd a 6 bed, 4 bath, 3,573 sqft North Nanaimo home listed for $1,099,000 (10% below its tax-assessed value).
The 3 least expensive new listings this week are 660 Albert St a 1 bed, 1 bath, 546 sqft Old City home listed for $349,900. 61 View St a 4 bed, 2 bath, 1,940 sqft South Nanaimo home listed for $499,000. 118 Finlayson St a 3 bed, 2 bath, 1,332 sqft Old City home listed for $569,000.
The 3 most expensive new listings this week are 2885 Shady Mile Way a 4 bed, 4 bath, 3,059 sqft North Jingle Pot home listed for $1,999,000. 2734 Yellow Point Rd a 4 bed, 2 bath, 2,007 sqft Cedar home listed for $1,229,000. 2070 Saras Way a 4 bed, 3 bath, 2,287 sqft Cedar home listed for $1,225,000.
Notable New Sales
The 3 buyers that secured the largest discounts this week are the buyers of 2145 Michigan Way who secured a 11% discount off the $949,900 asking price (sale price $848,000). The buyers of 7492 Clark Cres who secured a 10% discount off the $800,000 asking price (sale price $720,000). The buyers of 109 Camrose Pl who secured a 9% discount off the $765,000 asking price (sale price $697,000).
The 3 highest cost per sqft sales this week were 2357 Barclay St a 2 bed, 2 bath, 1,079 sqft Diver Lake home sold for $581,000 ($538/sqft), 722 Campbell St a 3 bed, 3 bath, 2,222 sqft Old City home sold for $1,150,000 ($518/sqft), 6130 Pine Ridge Cres a 2 bed, 2 bath, 1,299 sqft Pleasant Valley home sold for $650,000 ($500/sqft).
The 3 highest sales this week were 1520 Loat St a 4 bed, 3 bath, 3,281 sqft Departure Bay home sold for $1,175,000. 722 Campbell St a 3 bed, 3 bath, 2,222 sqft Old City home sold for $1,150,000. 290 Vancouver Ave a 5 bed, 4 bath, 3,588 sqft Brechin Hill home sold for $1,150,000.
If you are looking for details on a recent sale not mentioned here, email me and I will send you the sale price.
Categories
Recent Posts