Island Real Estate Trends and December 2023 Market Outlook

December 2023 Nanaimo Market Update
To watch the October 2023 Market Update, click the video window below!

Vancouver Island (not including Victoria)
236 single family homes sold. Average price: $792,067 (down 7% from 12 months to date, this year over last). Single-family unit sales volume is down 7%. Average days on market increased by 70% to 46 days. The average condo sold for $408,329. Condo unit sales are down 11%, 12 months to date. Condos have seen a 66% increase in days on market. Average days to sell is 48 days. The average row/townhouse sold for $570,210. Row/townhouse unit sales are down 2% 12 months to date. Row/townhouses have seen a 61% increase in days on market. Average days to sell is 45 days. Lot sales volume is down 25%. Lot prices have decreased by 19%, 12 months to date. Average lot sale price: $446,317. FULL REPORT HERE.
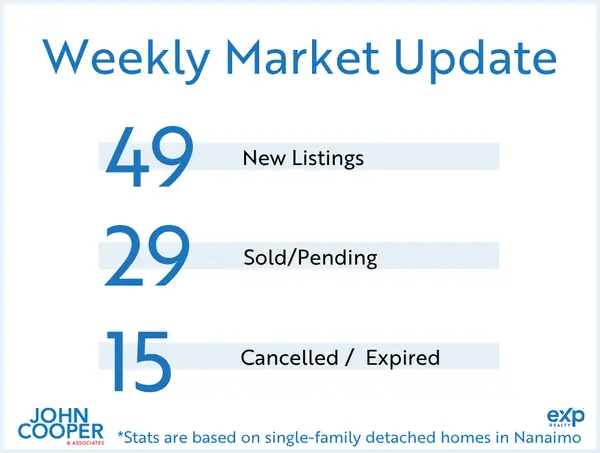
Nanaimo
63 single family homes sold. Average price: $820,693 (down 8% 12 months to date, this year over last). Single family unit sales volume is down 10%. Average days on market has increased by 64% to 36 days. The average condo sold for $438,916. Condo unit sales are down 17%, 12 months to date. Condos have seen a 81% increase in days on market. Average days to sell is 38 days. The average row/townhouse sold for $563,016. Row/townhouse unit sales are down 1% 12 months to date. Row/townhouses have seen a 52% increase in days on market. Average days to sell is 38 days. Lot sales volume is down by 38%. Lot prices have decreased by 45%, 12 months to date. Average lot sale price: $427,865. FULL REPORT HERE.
Parksville/Qualicum
35 single family homes sold. Average price: $928,672 (down 5% from 12 months to date, this year over last). Single-family unit sales volume is down 9%. Average days on market increased by 61% to 37 days. The average condo sold for $440,990. Condo unit sales are down 13%, 12 months to date. Condos have seen a 150% increase in days on market. Average days to sell is 40 days. The average row/townhouse sold for $656,006. Row/townhouse unit sales are down 8% 12 months to date. Row/townhouses have seen a 67% increase in days on market. Average days to sell is 35 days. Lot sales volume is down 49%. Lot prices have decreased by 17%, 12 months to date. Average lot sale price: $670,296. FULL REPORT HERE.
Cowichan Valley
42 single family homes sold. Average price: $785,666 (down 6% from 12 months to date, this year over last). Single-family unit sales volume is down 5%. Average days on market increased by 88% to 49 days. The average condo sold for $335,383. Condo unit sales are up 1%, 12 months to date. Condos have seen a 135% increase in days on market. Average days to sell is 54 days. The average row/townhouse sold for $563,252. Row/townhouse unit sales are up 1% 12 months to date. Row/townhouses have seen an 89% increase in days on market. Average days to sell is 51 days. Lot sales volume is down 20%. Lot prices have decreased by 31%, 12 months to date. Average lot sale price: $392,841. FULL REPORT HERE.
*waterfront homes are not included in the monthly statistics
Categories
Recent Posts