Island Real Estate Trends and June 2024 Market Outlook

June 2024
12 months to date sales are up, but so is inventory. Month-over-month sales are down. What should we expect to see moving forward? I am predicting subtle downward pressure on pricing, a subtle increase in available inventory, and stable demand. It's back to real estate fundamentals. Sellers need to price to the market, & respond to market feedback and buyers need to think long-term, be discerning and do their due diligence.
If you are a homeowner who is curious about your home’s value please reach out by replying to this email and setting up an appointment with me for a Free Property Valuation Report. If you are interested in potentially buying a home in Central Vancouver Island, I am taking appointments for Free Buyer Consultations. These consultations will empower you with the knowledge to make an informed decision as you navigate the local real estate market.
John Cooper
250.619.9207
john@johncooper.ca
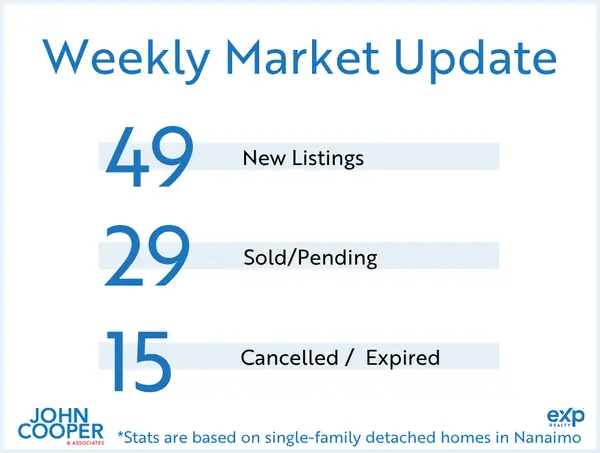
June 2024 Nanaimo Market Update

Vancouver Island (not including Victoria)
400 single-family homes sold. Average price: $814,369 (up 3% from 12 months to date, this year over last). Single-family unit sales volume is down 1%. Average days on market decreased by 2% to 43 days. The average condo sold for $414,795. Condo unit sales are up 21%, 12 months to date. Condos have seen an increase by 14% in days on market. Average days to sell is 48 days. The average row/townhouse sold for $581,912. Row/townhouse unit sales are up 25%, 12 months to date. Row/townhouses have seen an increase by 9% in days on market. Average days to sell is 47 days. Lot sales volume is up 15%. Lot prices have increased by 6%, 12 months to date. Average lot sale price: $458,269. FULL REPORT HERE.
Nanaimo
100 single-family homes sold. Average price: $843,663 (up 3% from 12 months to date, this year over last). Single-family unit sales volume is up 5%. Average days on market decreased by 6% to 34 days. The average condo sold for $438 257. Condo unit sales are up 29%, 12 months to date. Condos have seen an increase by 11% in days on market. Average days to sell is 39 days. The average row/townhouse sold for $575,629. Row/townhouse unit sales are up 48%, 12 months to date. Row/townhouses have seen an increase by 5% in days on market. Average days to sell is 42 days. Lot sales volume is up 30%. Lot prices have decreased by 5%, 12 months to date. Average lot sale price: $471,292. FULL REPORT HERE.
Parksville/Qualicum
61 single-family homes sold. Average price: $970,848 (up 6% from 12 months to date, this year over last). Single-family unit sales volume is down 4%. Average days on market remains at 37 days. The average condo sold for $454,446. Condo unit sales are up 11%, 12 months to date. Condos have seen an increase by 45% in days on market. Average days to sell is 45 days. The average row/townhouse sold for $666,348. Row/townhouse unit sales are down 5%, 12 months to date. Row/townhouses have seen an increase by 13% in days on market. Average days to sell is 36 days. Lot sales volume is up 63%. Lot prices have increased by 15%, 12 months to date. Average lot sale price: $615,556. FULL REPORT HERE.
Cowichan Valley
83 single-family homes sold. Average price: $799,798 (up 3% from 12 months to date, this year over last). Single-family unit sales volume is up 3%. Average days on market remain at 45 days. The average condo sold for $337,550. Condo unit sales are up 40%, 12 months to date. Condos have seen an increase by 11% in days on market. Average days to sell is 50 days. The average row/townhouse sold for $576,672. Row/townhouse unit sales are up 32%, 12 months to date. Row/townhouses have seen an increase by 27% in days on market. Average days to sell is 57 days. Lot sales volume is up 19%. Lot prices have increased by 1%, 12 months to date. Average lot sale price: $438,226. FULL REPORT HERE.
*waterfront homes are not included in the monthly statistics
Categories
Recent Posts