Island Real Estate Trends and May 2024 Market Outlook

Spring 2024 is outperforming 2023 by every conceivable metric. Sales are up, inventory is up, rates are holding and consumer sentiment is up. This is good news for Vancouver Island. “Slow and steady, wins the race” and slow and steady has consistently been a trend in the Central Vancouver Island real estate market. 2019 to 2022 were anomalies for this market and I am happy to see that volatility subside. The market we are experiencing now is a healthy and sustainable market wherein buyers and sellers have reciprocal leverage and are able to make sound and informed decisions. Don’t be fooled. This is a balanced and healthy market.
If you are a homeowner who is curious about your home’s value please reach out by replying to this email and setting up an appointment with me for a Free Property Valuation Report. If you are interested in potentially buying a home in Central Vancouver Island, I am taking appointments for Free Buyer Consultations. These consultations will empower you with the knowledge to make an informed decision as you navigate the local real estate market.
John Cooper
250.619.9207
john@johncooper.ca

Vancouver Island (not including Victoria)
376 single-family homes sold. Average price: $811,313 (up 1% from 12 months to date, this year over last). Single-family unit sales volume is up 2%. Average days on market increased by 5% to 43 days. The average condo sold for $418,288. Condo unit sales are up 19%, 12 months to date. Condos have seen an increase by 23% in days on market. Average days to sell is 48 days. The average row/townhouse sold for $583,261. Row/townhouse unit sales are up 21%, 12 months to date. Row/townhouses have seen an increase by 21% in days on market. Average days to sell is 47 days. Lot sales volume is up 25%. Lot prices have decreased by 13%, 12 months to date. Average lot sale price: $455,780. FULL REPORT HERE.
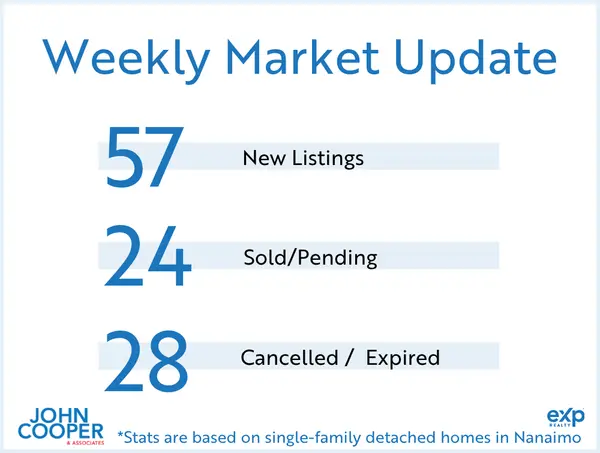
Nanaimo
109 single-family homes sold. Average price: $840,784 (up 2% from 12 months to date, this year over last). Single-family unit sales volume is up 4%. Average days on market decreased by 3% to 33 days. The average condo sold for $442,436. Condo unit sales are up 23%, 12 months to date. Condos have seen an increase by 15% in days on market. Average days to sell is 38 days. The average row/townhouse sold for $581,307. Row/townhouse unit sales are up 44%, 12 months to date. Row/townhouses have seen an increase by 8% in days on market. Average days to sell is 41 days. Lot sales volume is up 27%. Lot prices have decreased by 15%, 12 months to date. Average lot sale price: $470,296. FULL REPORT HERE.
Parksville/Qualicum
64 single-family homes sold. Average price: $960,874 (up 4% from 12 months to date, this year over last). Single-family unit sales volume is down 1%. Average days on market increased by 6% to 37 days. The average condo sold for $473,675. Condo unit sales are up 13%, 12 months to date. Condos have seen an increase by 61% in days on market. Average days to sell is 45 days. The average row/townhouse sold for $692,012. Row/townhouse unit sales are down 15%, 12 months to date. Row/townhouses have seen an increase by 16% in days on market. Average days to sell is 36 days. Lot sales volume is up 59%. Lot prices have increase by 16%, 12 months to date. Average lot sale price: $612,678. FULL REPORT HERE.
Cowichan Valley
62 single-family homes sold. Average price: $800,681 (up 1% from 12 months to date, this year over last). Single-family unit sales volume is up 3%. Average days on market increased by 10% to 45 days. The average condo sold for $333,810. Condo unit sales are up 34%, 12 months to date. Condos have seen an increase by 21% in days on market. Average days to sell is 52 days. The average row/townhouse sold for $576,784. Row/townhouse unit sales are up 24%, 12 months to date. Row/townhouses have seen an increase by 36% in days on market. Average days to sell is 57 days. Lot sales volume is up 18%. Lot prices have decreased by 21%, 12 months to date. Average lot sale price: $437,063. FULL REPORT HERE.
*waterfront homes are not included in the monthly statistics

Unlocking Property Ownership: What you need to know
#johncooper #realestate #growth #accountability #love #kindness

Define Your Own Success: Letting go of Comparison in Real Estate and Life
When we define our success relative to others we hand the key to our happiness to a metric that we no longer get to define for ourselves. This loss of control increases our stress and anxiety. This increase in stress and anxiety overflows into our relationships with our loved ones and the relationships we have with ourselves. The real estate trading industry is one of the worst modern industries for these comparisons. For almost a decade I let this mindset of constant comparison rob me of my contentment. It negatively impacted my relationships and my health. Take your power back and define success for yourself. Do not let Gross Commission Income rankings impact your self-worth. It's a mistake. Success is defined by our health, our relationships, and our gratitude.

Finding Your Perfect Home: Balancing Emotion and Investment with John Cooper, Real Estate Advisor
Categories
Recent Posts