Island Real Estate Trends and November 2023 Market Outlook

November 2023
With Less than 8 weeks remaining in 2023, it is a perfect time to define your real estate plan for 2024. Presently interest rates are holding steady and the industry is reasonably optimistic that this will hold into Q1 2024. Are prices going to start rising in 2024? My instincts suggest no, they will not. Is the bottom going to fall out of this market with buyers gaining substantial negotiating leverage and massive discounts? My instincts suggest no, they will not. In order for prices to rise we would need to see a dramatic increase in sales. An absolute necessity of this type of demand is access to inexpensive capital which is not in the forecast. Conversely, for prices to decline, there would need to be an equally dramatic increase in inventory. You are probably asking yourself, why has inventory not increased despite the challenging lending climate? I believe it is because when a homeowner moves, it will often trigger a mortgage requalification. This can be a time-consuming and unpredictable process. Particularly during a period when Canadians are carrying unprecedented levels of household debt. Additionally, appraisal values are inconsistent during market shifts like the one we are experiencing now. Although this market poses challenges for both buyers and sellers, it could be much worse. As an Islander, I consider ourselves lucky, not just because we get to live in the nicest region on planet earth, but because we have lifestyle demand that is economically agnostic, meaning, regardless of what is going on economically there are people all over the planet are willing to make an effort and take a risk to call this place home.
If you have a real estate decision in front of you or want to plan ahead to mitigate your risk exposure, call me. I am happy to talk to you about it. No sales pressure. No tactics. Just helpful guidance to move you forward. Reach out anytime and for any reason.
John Cooper
250.619.9207
john@coopergroup.ca
October 2023 Nanaimo Market Update
As we all know, making informed decisions starts with having access to accurate information. Therefore, I am pleased to present the Nanaimo Real Estate Market Update for November 2023. This update offers a comprehensive snapshot of the current market conditions, and I invite you to watch the video to gain valuable insights.
If you have any questions or require further information, please do not hesitate to reach out. As always, I am here to provide my insights and help you make informed decisions in the Nanaimo real estate market!
To watch the October 2023 Market Update, click the video window below!
Most Recent Market Statistics (October 2023)*
Vancouver Island (not including Victoria)
244 single family homes sold. Average price: $789,341 (down 7% from 12 months to date, this year over last). Single-family unit sales volume is down 9%. Average days on market increased by 77% to 46 days. The average condo sold for $407,729. Condo unit sales are down16%, 12 months to date. Condos have seen a 66% increase in days on market. Average days to sell is 48 days. The average row/townhouse sold for $568,474. Row/townhouse unit sales are down 8% 12 months to date. Row/townhouses have seen a 67% increase in days on market. Average days to sell is 45 days. Lot sales volume is down 31%. Lot prices have decreased by 21%, 12 months to date. Average lot sale price: $437,422. FULL REPORT HERE.
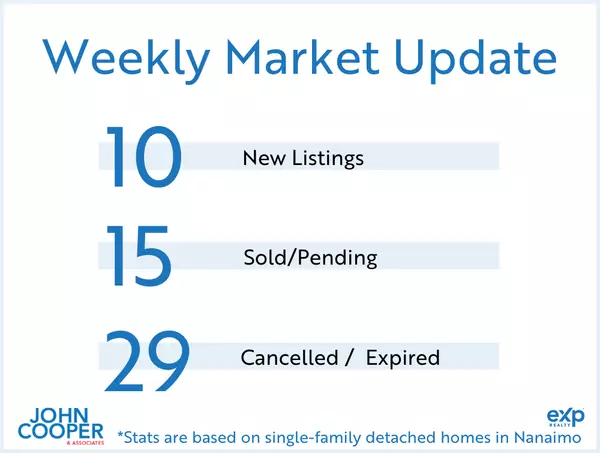
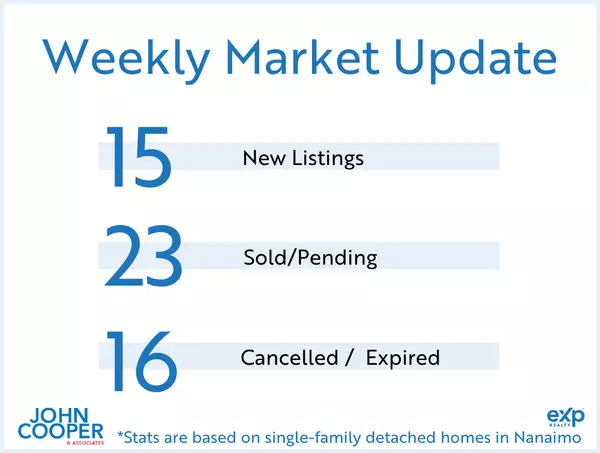
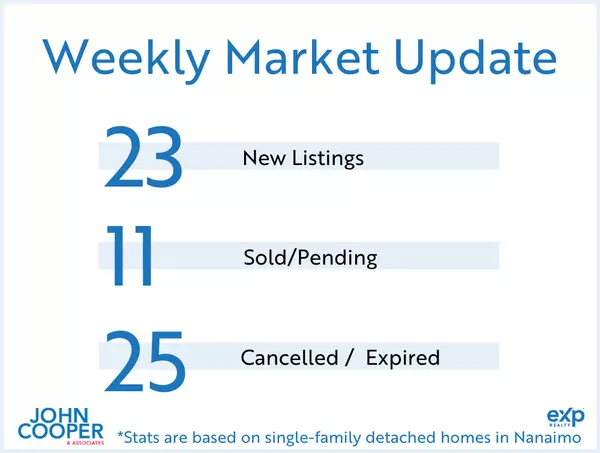
Nanaimo
67 single family homes sold. Average price: $818,228 (down 9% 12 months to date, this year over last). Single family unit sales volume is down 14%. Average days on market has increased by 71% to 36 days. The average condo sold for $437,519. Condo unit sales are down 22%, 12 months to date. Condos have seen a 90% increase in days on market. Average days to sell is 38 days. The average row/townhouse sold for $562,464. Row/townhouse unit sales are down 10% 12 months to date. Row/townhouses have seen a 73% increase in days on market. Average days to sell is 38 days. Lot sales volume is down by 54%. Lot prices have decreased by 40%, 12 months to date. Average lot sale price: $436,854. FULL REPORT HERE.
Parksville/Qualicum
37 single family homes sold. Average price: $920,255 (down 6% 12 months to date, this year over last). Single family unit sales volume is down by 7%. Average days on market increased by 90% to 38 days. The average condo sold for $438,252. Condo unit sales are down 19%, 12 months to date. Condos have seen a 233% increase in days on market. Average days to sell is 40 days. The average row/townhouse sold for $658,763. Row/townhouse unit sales are down 14% 12 months to date. Row/townhouses have seen a 100% increase in days on market. Average days to sell is 36 days. Lot sales volume is down by 57%. Lot prices have increased by 5%, 12 months to date. Average lot sale price: $608,916. FULL REPORT HERE.
Cowichan Valley
36 single family homes sold. Average price: $781,526 (down 7% from 12 months to date, this year over last). Single-family unit sales volume is down 7%. Average days on market increased by 96% to 49 days. The average condo sold for $333,263. Condo unit sales are down 6%, 12 months to date. Condos have seen a 140% increase in days on market. Average days to sell is 53 days. The average row/townhouse sold for $559,548. Row/townhouse unit sales are down 6% 12 months to date. Row/townhouses have seen an 85% increase in days on market. Average days to sell is 50 days. Lot sales volume is down 28%. Lot prices have decreased by 28%, 12 months to date. Average lot sale price: $403,470. FULL REPORT HERE.
*waterfront homes are not included in the monthly statistics
Categories
Recent Posts


