Nanaimo Real Estate Market Update - August 2023

August 2023
Don’t fall victim to the FOMO anxiety that is all too common when August hits and translate that stress to action and get out there and enjoy our island! As the sun continues to grace us with its warmth, the real estate landscape remains equally vibrant. The trends we've witnessed over the past months seem poised to keep most of their momentum, creating an opportune environment for both buyers and sellers. While temperatures might be high, there's a sense that this sizzling market might be accompanied by a touch of cooling in the coming months. As we embrace the latter part of the year, it's reasonable to anticipate a gentle ebb in the pace of the Vancouver Island real estate market. The shifts appear to be gradual, hinting at a market that's transitioning towards long-term stability rather than abrupt change. It's a time to evaluate your goals and aspirations and to plan wisely for your future in real estate. I'm committed to providing you with insightful data and guidance untainted by pushy sales tactics, so feel free to connect with me for any assistance you may need on your real estate journey. I am here to help.
- John Cooper
August 2023 Nanaimo Market Update
As we all know, making informed decisions starts with having access to accurate information. Therefore, I am pleased to present the Nanaimo Real Estate Market Update for August 2023. This update offers a comprehensive snapshot of the current market conditions, and I invite you to watch the video to gain valuable insights.
If you have any questions or require further information, please do not hesitate to reach out. As always, I am here to provide my insights and help you make informed decisions in the Nanaimo real estate market!
To watch the August 2023 Market Update, click the video window below!

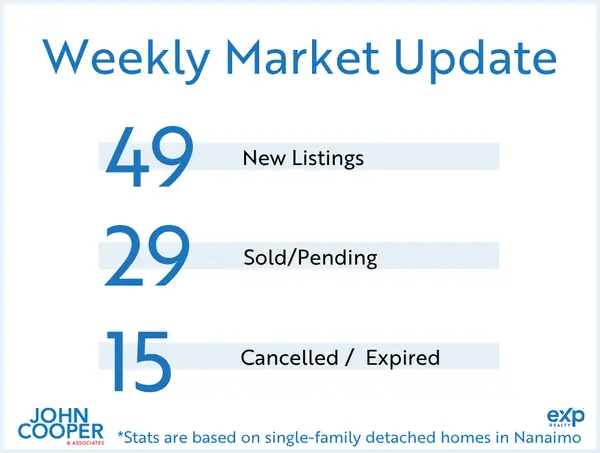
Most Recent Market Statistics (July 2023)*
Vancouver Island (not including Victoria)
414 single family homes sold. Average price: $786,861 (down 6% from 12 months to date, this year over last). Single-family unit sales volume is down 20%. Average days on market increased by 100% to 46 days. The average condo sold for $405,677. Condo unit sales are down 34%, 12 months to date. Condos have seen a 68% increase in days on market. Average days to sell is 47 days. The average row/townhouse sold for $559,198. Row/townhouse unit sales are down 24% 12 months to date. Row/townhouses have seen a 76% increase in days on market. Average days to sell is 44 days. Lot sales volume is down 41%. Lot prices have decreased by 23%, 12 months to date. Average lot sale price: $425,632 FULL REPORT HERE.
Nanaimo
112 single family homes sold. Average price: $814,848 (down 9% 12 months to date, this year over last). Single family unit sales volume is down 28%. Average days on market has increased by 106% to 37 days. The average condo sold for $435,006. Condo unit sales are down 39%, 12 months to date. Condos have seen a 95% increase in days on market. Average days to sell is 37 days. The average row/townhouse sold for $551,244. Row/townhouse unit sales are down 26% 12 months to date. Row/townhouses have seen a 100% increase in days on market. Average days to sell is 38 days. Lot sales volume is down by 57%. Lot prices have decreased by 38%, 12 months to date. Average lot sale price: $473,967. FULL REPORT HERE.
Parksville/Qualicum
50 single family homes sold. Average price: $923,640 (down 5% 12 months to date, this year over last). Single family unit sales volume is down by 15%. Average days on market increased by 144% to 39 days. The average condo sold for $415,427. Condo unit sales are down 34%, 12 months to date. Condos have seen a 129% increase in days on market. Average days to sell is 39 days. The average row/townhouse sold for $639,689. Row/townhouse unit sales are down 17% 12 months to date. Row/townhouses have seen a 140% increase in days on market. Average days to sell is 36 days. Lot sales volume is down by 70%. Lot prices have increased by 9%, 12 months to date. Average lot sale price: $584,736. FULL REPORT HERE.
Cowichan Valley
88 single family homes sold. Average price: $778,107 (down 7% from 12 months to date, this year over last). Single-family unit sales volume is down 15%. Average days on market increased by 133% to 49 days. The average condo sold for $335,738. Condo unit sales are down 20%, 12 months to date. Condos have seen a 244%% increase in days on market. Average days to sell is 55 days. The average row/townhouse sold for $549,249. Row/townhouse unit sales are down 20% 12 months to date. Row/townhouses have seen an 117% increase in days on market. Average days to sell is 50 days. Lot sales volume is down 20%. Lot prices have decreased by 28%, 12 months to date. Average lot sale price: $402,844. FULL REPORT HERE.
*waterfront homes are not included in the monthly statistics
Building A Custom Home VS. Buying An Existing Home
Click below to watch the video!

Due Diligence Is Back In Real Estate!

Please reach out with any questions you may have! Enjoy the rest of your summer on beautiful Vancouver Island!
Warmest of regards,
John Cooper
John Cooper Group - eXp Realty
250.619.9207
Categories
Recent Posts