June 2026 Newsletter

by John Cooper

June 2026
 
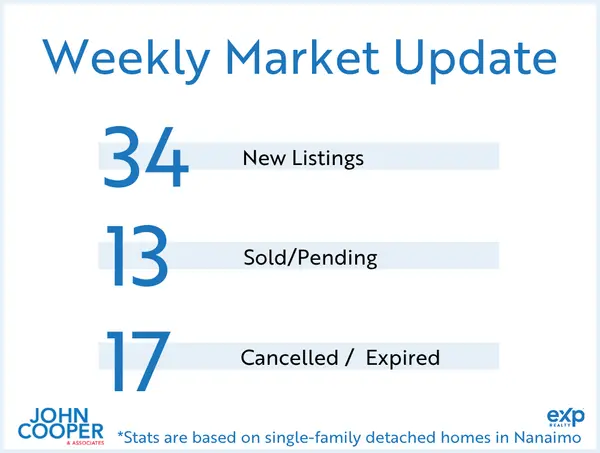
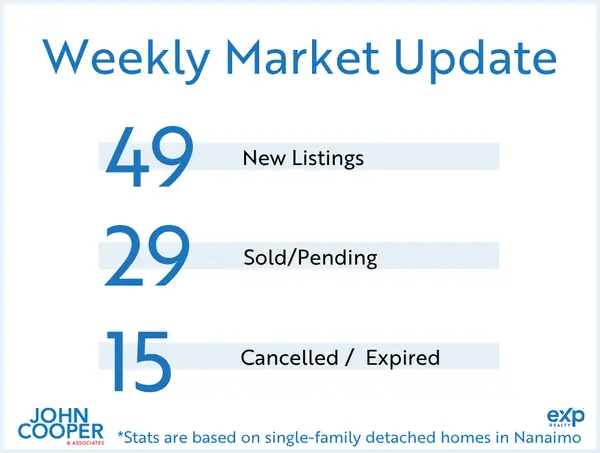
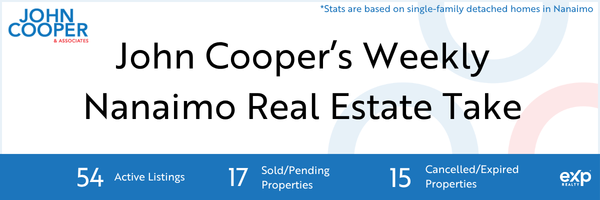
The Supply Inflow is Moderating:

With 54 new listings, we are well below the mid-May peaks of 76–77. The initial rush of sellers trying to catch the absolute peak of the spring market has naturally begun to taper off as we head toward summer.

A Temporary Buyer Lull:

Sales volume pulled back to 17 units—the quietest week for demand we’ve seen since mid-February. This is a common pattern as buyers take time to digest the massive wave of listings added over the last 45 days.

The Post-Rush Stabilization:

Cancelled and expired listings dropped significantly to 15 (nearly half of what we saw in early May). This tells us that the initial wave of over-optimistic pricing corrections has run its course. The market is stabilizing, and current sellers are pricing much closer to reality out of the gate.

The June 10th Waiting Game:

With the next Bank of Canada interest rate announcement coming up on Wednesday, June 10th, it is highly likely that some buyers are deliberately hitting the pause button. Even though the rate is widely expected to hold steady at 2.25%, fence-sitters often wait for the official press conference before locking in a mortgage.

🏠 Synopsis for a Nanaimo Homeowner Weighing Their Options

June Week 1 is telling us that the market is transitioning from a high-energy sprint into a steady, predictable balance.

For Sellers: The massive flood of new competition has slowed down, which gives your property a better chance to stand out. However, because weekly sales dipped to 17, you cannot afford to test the market with an inflated price. Buyers have accumulated an increase in choice from April and May; they are well-educated on values and are taking their time.

For Buyers: The drop in weekly absorption to 31.5% is fantastic news for your purchasing leverage. The initial "panic" of the spring rush has completely cleared out. You have a deeper pool of active inventory to choose from, less immediate competition on open houses, and a stabilized interest rate environment. This week offers a clean, low-stress window to write offers with proper due diligence.

The Strategy: If you are trying to time a transition from a starter home to a larger property, the current stability minimizes your risk. You can list your home into a market where realistic pricing prevents stagnation, and shop for your next home with genuine leverage.

- John Cooper

Most Recent Market Statistics (May 2026)*

Vancouver Island (not including Victoria)

384 single-family homes sold. Average price: $827,927 (up 1% from 12 months to date, this year over last). Single-family unit sales volume is up .5%. Average days on market decreased 4% to 48 days. The average condo sold for $418,767. Condo unit sales are down 11%, 12 months to date. Condos have seen an increased of 12% in days on market. Average days to sell is 66 days. The average row/townhouse sold for $578,777. Row/townhouse unit sales are down 2.5%, 12 months to date. Row/townhouses have seen an increase of 7% in days on market. Average days to sell is 58 days. Lot sales volume is down 14%. Lot prices have increased by 11%, 12 months to date. Average lot sale price: $513,818.


Nanaimo

107 single-family homes sold. Average price: $851,988 (up .5% from 12 months to date, this year over last). Single-family unit sales volume is up9%. Average days on market decreased by 2% to 41 days. The average condo sold for $437,188. Condo unit sales are down 22%, 12 months to date. Condos have seen an increase of 6% in days on market. Average days to sell is 55 days. The average row/townhouse sold for $552,596. Row/townhouse unit sales are decreased by 10%, 12 months to date. Row/townhouses have seen an increase of 20% in days on market. Average days to sell is 47 days. Lot sales volume is down 28%. Lot prices have decreased by 15%, 12 months to date. Average lot sale price: $492,659.


Parksville/Qualicum

53 single-family homes sold. Average price: $955,177 (up .5% from 12 months to date, this year over last). Single-family unit sales volume is down 9%. Average days on market decreased by 7% to 39 days. The average condo sold for $473,725. Condo unit sales have decreased by 10%, 12 months to date. Condos have seen a increased by13% in days on market. Average days to sell is 60 days. The average row/townhouse sold for $689,494. Row/townhouse unit sales are down 5%, 12 months to date. Row/townhouses have seen an increase of 10% in days on market. Average days to sell is 57 days. Lot sales volume is up 24%. Lot prices have decreased by 4%, 12 months to date. Average lot sale price: $543,439.


Cowichan Valley

85 single-family homes sold. Average price: $823,488 (up 3% from 12 months to date, this year over last). Single-family unit sales volume is down 3%. Average days on market decreased by 8% to 49 days. The average condo sold for $347,515. Condo unit sales are up 19%, 12 months to date. Condos have seen an increase of 19% in days on market. Average days to sell is 62 days. The average row/townhouse sold for $574,245. Row/townhouse unit sales have increased 17%, 12 months to date. Row/townhouses have seen an increase of 11% in days on market. Average days to sell is 68 days. Lot sales volume is down 28%. Lot prices have increased by 28%, 12 months to date. Average lot sale price: $578,893.


Leave a Reply

Message

Message

Name

Name

Phone*

Phone