April Newsletter 2025

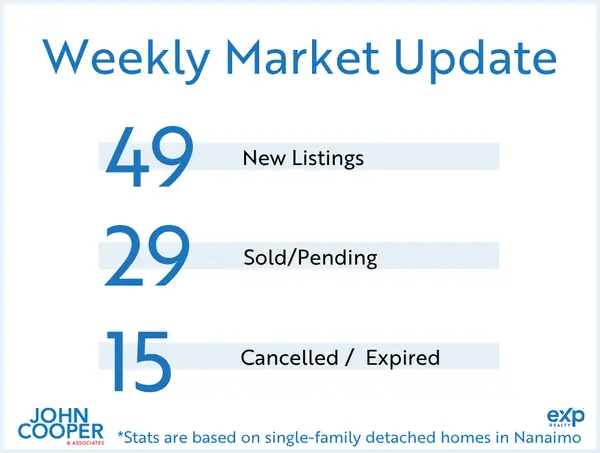
This was a record week for new listings with 80 single family homes being introduced to the Nanaimo market in the last 7 days. This is the highest number of homes listed in a 7 day period since we started publishing these weekly reports (24 months). Sales are holding steady with 23 homes selling in the last 7 days. Despite the record number of new listings, we are still observing balanced market conditions in Nanaimo. The May statistics will be a better indicator of which direction the market will be trending. Stay tuned.
Interested in Your Home's Value?
The time for 2025 real estate planning is now! Email me for a personalized market assessment. I respond to every inquiry personally and prioritize open communication with my clients. I'm here to help!
John Cooper
250.619.9207
john@johncooper.ca

Most Recent Market Statistics (March 2025)*
Vancouver Island (not including Victoria)
239 single-family homes sold. Average price: $818,883 (up 2% from 12 months to date, this year over last). Single-family unit sales volume is up 1%. Average days on market increased by 7% to 48 days. The average condo sold for $424,780. Condo unit sales are down 3%, 12 months to date. Condos have seen an increase by 19% in days on market. Average days to sell is 56 days. The average row/townhouse sold for $584,985. Row/townhouse unit sales are up 14%, 12 months to date. Row/townhouses have seen an increase by 22% in days on market. Average days to sell is 56 days. Lot sales volume is up 2%. Lot prices have decreased by 2%, 12 months to date. Average lot sale price: $446,808. FULL REPORT HERE.
Nanaimo
61 single-family homes sold. Average price: $841,580 (up 1% from 12 months to date, this year over last). Single-family unit sales volume is up 1%. Average days on market increased by 21% to 41 days. The average condo sold for $440,662. Condo unit sales have seen no change, 12 months to date. Condos have seen an increase by 42% in days on market. Average days to sell is 51 days. The average row/townhouse sold for $557,027. Row/townhouse unit sales are up 10%, 12 months to date. Row/townhouses have seen an increase by 8% in days on market. Average days to sell is 43 days. Lot sales volume is up 24%. Lot prices have increased by 22%, 12 months to date. Average lot sale price: $577,166. FULL REPORT HERE.
Parksville/Qualicum
40 single-family homes sold. Average price: $962,770 (up 2% from 12 months to date, this year over last). Single-family unit sales volume is up 8%. Average days on market increased by 8% to 41 days. The average condo sold for $478,658. Condo unit sales are down 2%, 12 months to date. Condos have seen an increase by 21% in days on market. Average days to sell is 52 days. The average row/townhouse sold for $659,255. Row/townhouse unit sales are up 30%, 12 months to date. Row/townhouses have seen an increase by 44% in days on market. Average days to sell is 49 days. Lot sales volume is down 21%. Lot prices have decreased by 11%, 12 months to date. Average lot sale price: $547,998. .FULL REPORT HERE..
Cowichan Valley
50 single-family homes sold. Average price: $795,784 (No change from 12 months to date, this year over last). Single-family unit sales volume is up 4%. Average days on market increased by 13% to 58 days. The average condo sold for $348,357. Condo unit sales are down 12%, 12 months to date. Condos have seen a decrease by 8% in days on market. Average days to sell is 48 days. The average row/townhouse sold for $559,396. Row/townhouse unit sales are down 1%, 12 months to date. Row/townhouses have seen an increase by 7% in days on market. Average days to sell is 61 days. Lot sales volume is down 5%. Lot prices have increased by 15%, 12 months to date. Average lot sale price: $474,068. FULL REPORT HERE.
Categories
Recent Posts