December Newsletter 2024

December 2024
The last 12 months have seen a modest reduction in interest rates, combined with a modest increase in housing inventory. This has led to balanced market conditions for most of 2024. Sellers waiting for prices to increase are being met with market resistance. Buyers waiting for prices to drop are seeing prices hold steady. It is my prediction that this trend will continue into 2025. Rates will continue to come down subtly, inventory will continue to increase subtly. Trading volume will continue to hold. Considering global macroeconomic factors, this is a positive outlook for 2025 in Central Vancouver Island.
Interested in Your Home's Value?
The time for 2025 real estate planning is now! Email me for a personalized market assessment. I respond to every inquiry personally and prioritize open communication with my clients. I'm here to help!
John Cooper
250.619.9207
john@johncooper.ca
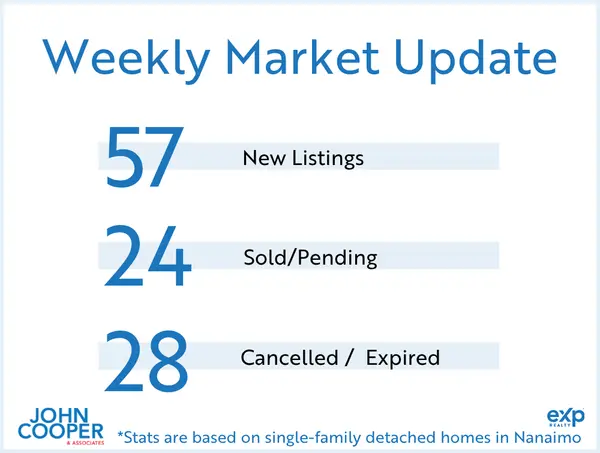
December 2024 Nanaimo Market Update

Most Recent Market Statistics (November 2024)*
Vancouver Island (not including Victoria)
267 single-family homes sold. Average price: $816,466 (up 3% from 12 months to date, this year over last). Single-family unit sales volume is down 3%. Average days on market increased by 2% to 47 days. The average condo sold for $430,930. Condo unit sales are down 1%, 12 months to date. Condos have seen an increase by 10% in days on market. Average days to sell is 53 days. The average row/townhouse sold for $587,986. Row/townhouse unit sales are up 15%, 12 months to date. Row/townhouses have seen an increase by 20% in days on market. Average days to sell is 54 days. Lot sales volume is up 2%. Lot prices haveseen no change, 12 months to date. Average lot sale price: $445,520. FULL REPORT HERE.
Nanaimo
69 single-family homes sold. Average price: $841,201 (up 3% from 12 months to date, this year over last). Single-family unit sales volume is down 3%. Average days on market increased by 6% to 38 days. The average condo sold for $446,750. Condo unit sales are up 3%, 12 months to date. Condos have seen an increase by 26% in days on market. Average days to sell is 48 days. The average row/townhouse sold for $563,577. Row/townhouse unit sales are up 10%, 12 months to date. Row/townhouses have seen an increase by 13% in days on market. Average days to sell is 43 days. Lot sales volume is up 18%. Lot prices have increased by 43%, 12 months to date. Average lot sale price: $613,161. FULL REPORT HERE.
Parksville/Qualicum
47 single-family homes sold. Average price: $970,727 (up 5% from 12 months to date, this year over last). Single-family unit sales volume is up 7%. Average days on market increased by 11% to 41 days. The average condo sold for $489,791. Condo unit sales are up 19%, 12 months to date. Condos have seen an increase by 35% in days on market. Average days to sell is 54 days. The average row/townhouse sold for $667,917. Row/townhouse unit sales are up 26%, 12 months to date. Row/townhouses have seen an increase by 26% in days on market. Average days to sell is 44 days. Lot sales volume is up 3%. Lot prices have decreased by 21%, 12 months to date. Average lot sale price: $527,725. FULL REPORT HERE.
Cowichan Valley
60 single-family homes sold. Average price: $792,812 (up 1% from 12 months to date, this year over last). Single-family unit sales volume is down 3%. Average days on market decreased by 2% to 48 days. The average condo sold for $350,771. Condo unit sales are down 9%, 12 months to date. Condos have seen a decrease by 15% in days on market. Average days to sell is 46 days. The average row/townhouse sold for $568,071. Row/townhouse unit sales are up 4%, 12 months to date. Row/townhouses have seen an increase by 27% in days on market. Average days to sell is 65 days. Lot sales volume is down 7%. Lot prices have increased by 19%, 12 months to date. Average lot sale price: $469,001. FULL REPORT HERE.
Categories
Recent Posts