|
FULL REPORT HERE.
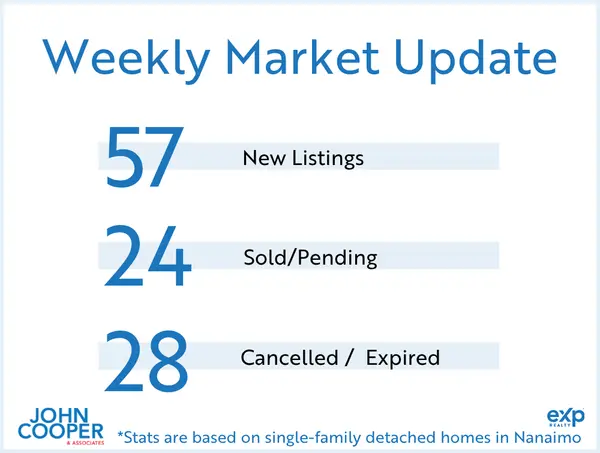
Notable New Listings
I like to start by outlining the best value based on $/sqft. The 3 best value homes listed this week are 105 Timber View Dr a 5 bed, 2 bath, 2,549 sqft South Jingle Pot home listed for $715,000 ($281/sqft), 1114 Thunderbird Dr a 6 bed, 2 bath, 2,720 sqft Central Nanaimo home listed for $769,900 ($283/sqft), 3656 Glen Oaks Dr a 4 bed, 3 bath, 3,456 sqft Hammond Bay home listed for $1,050,000 ($304/sqft).
The 3 homes listed this week with the highest $/sqft are 2405 Lindsey Rd a 2 bed, 2 bath, 1,472 sqft Cedar home listed for $1,299,000 ($882/sqft), 5378 Rutherford Rd a 2 bed, 2 bath, 1,319 sqft North Nanaimo home listed for $894,900 ($678/sqft), 759 Cadogan St a 2 bed, 1 bath, 840 sqft Central Nanaimo home listed for $535,900 ($638/sqft).
The 3 homes priced the most below their assessed value are 2700 Ritten Rd a 4 bed, 3 bath, 3,070 sqft Cedar home listed for $1,850,000 (11% below its tax-assessed value), 909 Brookfield Pl a 3 bed, 2 bath, 1,256 sqft South Nanaimo home listed for $699,000 (10% below its tax-assessed value), 5378 Rutherford Rd a 2 bed, 2 bath, 1,319 sqft North Nanaimo home listed for $894,900 (8% below its tax-assessed value).
The 3 least expensive new listings this week are 115 Haliburton St a 3 bed, 2 bath, 1,160 sqft South Nanaimo home listed for $499,900. 759 Cadogan St a 2 bed, 1 bath, 840 sqft Central Nanaimo home listed for $535,900. 38 Machleary St a 4 bed, 2 bath, 1,709 sqft Old City home listed for $682,000.
The 3 most expensive new listings this week are 2700 Ritten Rd a 4 bed, 3 bath, 1,160 sqft Cedar home listed for $1,850,000. 120 Hawk Point Rd a 5 bed, 5 bath, 3,157 sqft North Nanaimo home listed for $1,799,999. 4684 Ambience Dr a 7 bed, 5 bath, 4,098 sqft North Nanaimo home listed for $1,739,000.
Notable New Sales
The 3 buyers that secured the largest discounts this week are the buyers of 2204 Belwood Rd who secured a 13% discount off the $1,199,000 asking price (sale price $1,040,000). The buyers of 3640 Sundown Dr who secured a 13% discount off the $1,278,000 asking price (sale price $1,110,000). The buyers of 2974 Haslam Rd who secured a 10% discount off the $2,650,000 asking price (sale price $2,385,000).
The 3 highest cost per sqft sales this week were 2974 Haslam Rd a 6 bed, 5 bath, 4,320 sqft Cedar home sold for $2,385,000 ($552/sqft), 1072 Silver Mountain Dr a 3 bed, 2 bath, 1,442 sqft South Nanaimo home sold for $718,000 ($498/sqft), 2385 Marlborough Dr a 5 bed, 2 bath, 1,634 sqft Departure Bay home sold for $715,000 ($438/sqft).
The 3 highest sales this week were 2974 Haslam Rd a 6 bed, 5 bath, 4,320 sqft Cedar home sold for $2,385,000. 5760 Linley Valley Dr a 6 bed, 4 bath, 3,521 sqft North Nanaimo home sold for $1,127,500. 3640 Sundown Dr a 3 bed, 3 bath, 3,242 sqft Hammond Bay home sold for $1,110,000.
If you are looking for details on a recent sale not mentioned here, email me and I will send you the sale price.
This Week in John’s Life
It never fails; the moment the BC Assessment notices land in mailboxes, my phone starts ringing! Everyone wants to calibrate those tax valuations for accuracy, and it is a task I’m always happy to help with. If you’ve received yours and want a professional "gut check" on the numbers, just reply to this email or send me a message; I’d love to help you find some clarity.
On the professional front, last week was incredibly rewarding. I had the honor of serving as the real estate expert for two sold-out RBC Estate Planning seminars right here in Nanaimo. It’s a privilege to help people plan for their future in a no-pressure environment, supported by a fantastic team of experts like Alan and Scott at RBC and Parker and Brian at Krog & Co.
Finally, on a personal note, we’ve hit a major milestone: Avery passed her driver’s exam! She is now the proud owner of my vintage 1997 Honda CRV. While I’m so proud of her, it officially marks the end of an era. I no longer have the "job" of driving the girls to school. It’s only been two days, and I have to admit, I miss those morning chats dearly.
Interested in Your Home's Value?
Just like monitoring the value of your investment portfolio, it is important to monitor the value of your real estate holdings. Your BC Assessment Value should never be relied upon for financial decisions. Email me for a personalized market assessment. I respond to every inquiry personally and prioritize open communication with my clients. I'm here to help!
John Cooper
250.619.9207
john@johncooper.ca
Never miss an update! Subscribe here.
|