May Newsletter 2025

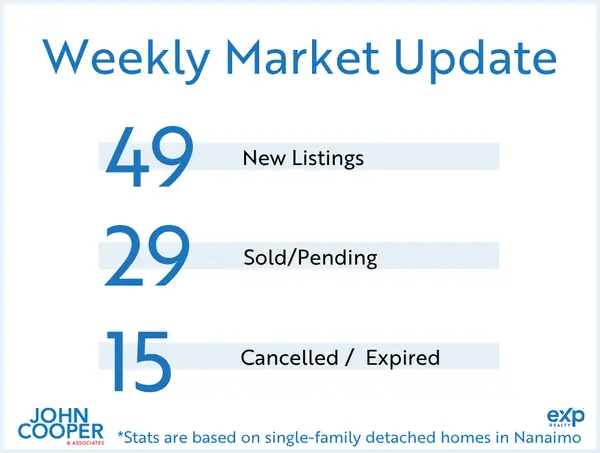
Single-family detached home sales are holding steady with 30 homes (+/- 5 homes) selling every week. The number of homes being introduced to the market has much higher variability. 72 homes were listed last week, up from 52 the previous week. May is typically the busiest month of the year and I expect this May to perform similarly.
Interested in Your Home's Value?
The time for 2025 real estate planning is now! Email me for a personalized market assessment. I respond to every inquiry personally and prioritize open communication with my clients. I'm here to help!
John Cooper
250.619.9207
john@johncooper.ca

Most Recent Market Statistics (April 2025)*
Vancouver Island (not including Victoria)
401 single-family homes sold. Average price: $819,909 (up 1% from 12 months to date, this year over last). Single-family unit sales volume is up 5%. Average days on market increased by 16% to 50 days. The average condo sold for $435,415. Condo unit sales have seen no change, 12 months to date. Condos have seen an increase by 16% in days on market. Average days to sell is 57 days. The average row/townhouse sold for $584,180. Row/townhouse unit sales are up 13%, 12 months to date. Row/townhouses have seen an increase by 15% in days on market. Average days to sell is 54 days. Lot sales volume is down 2%. Lot prices have increased by 5%, 12 months to date. Average lot sale price: $465,121. FULL REPORT HERE.
Nanaimo
108 single-family homes sold. Average price: $846,767 (up 1% from 12 months to date, this year over last). Single-family unit sales volume is down 1%. Average days on market increased by 27% to 42 days. The average condo sold for $448,639. Condo unit sales are up 10%, 12 months to date. Condos have seen an increase by 34% in days on market. Average days to sell is 51 days. The average row/townhouse sold for $552,994. Row/townhouse unit sales are up 4%, 12 months to date. Row/townhouses have seen a decrease by 3% in days on market. Average days to sell is 40 days. Lot sales volume is up 29%. Lot prices have increased by 28%, 12 months to date. Average lot sale price: $592,867. FULL REPORT HERE.
Parksville/Qualicum
67 single-family homes sold. Average price: $955,060 (No change from 12 months to date, this year over last). Single-family unit sales volume is up 15%. Average days on market increased by 11% to 42 days. The average condo sold for $485,856. Condo unit sales are up 3%, 12 months to date. Condos have seen an increase by 13% in days on market. Average days to sell is 51 days. The average row/townhouse sold for $658,568. Row/townhouse unit sales are up 43%, 12 months to date. Row/townhouses have seen an increase by36% in days on market. Average days to sell is 49 days. Lot sales volume is down 7%. Lot prices have decrease by 9%, 12 months to date. Average lot sale price: $555,331. FULL REPORT HERE.
Cowichan Valley
63 single-family homes sold. Average price: $793,153 (down 1% from 12 months to date, this year over last). Single-family unit sales volume is up 8%. Average days on market increased by 16% to 52 days. The average condo sold for $354,947. Condo unit sales are down 25%, 12 months to date. Condos have seen a decrease by 8% in days on market. Average days to sell is 48 days. The average row/townhouse sold for $561,685. Row/townhouse unit sales have seen no change, 12 months to date. Row/townhouses have seen no change in days on market. Average days to sell is 57 days. Lot sales volume is down 26%. Lot prices have increased by 4%, 12 months to date. Average lot sale price: $452,539. FULL REPORT HERE
Categories
Recent Posts