October Newsletter 2025

by John Cooper


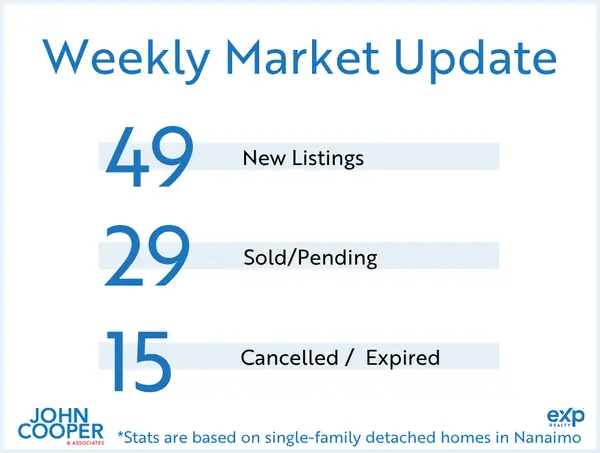
The number of new single family homes listed in Nanaimo increased for the 2nd week in a row. 50 new listings were launched last week. This is up from 38 new listings the previous week. This new inventory has been met with a moderate appetite for new listings with only 13 single family homes selling in Nanaimo last week. That is the 2nd week in a row for sales declines. Could this be the turning point being experienced in our neighbouring markets, or will Nanaimo continue to outperform the Canadian averages? I will be watching this closely over the next 8 weeks.

Interested in Your Home's Value?

Just like monitoring the value of your investment portfolio, it is important to monitor the value of your real estate holdings. Your BC Assessment Value should never be relied upon for financial decisions. Email me for a personalized market assessment. I respond to every inquiry personally and prioritize open communication with my clients. I'm here to help!

John Cooper
250.619.9207
john@johncooper.ca


Most Recent Market Statistics (September 2025)*

Vancouver Island (not including Victoria)

307 single-family homes sold. Average price: $823,344 (up 1% from 12 months to date, this year over last). Single-family unit sales volume is up 13%. Average days on market increased by 9% to 49 days. The average condo sold for $437,565. Condo unit sales are up 2%, 12 months to date. Condos have seen a increased by 15% in days on market. Average days to sell is 60 days. The average row/townhouse sold for $585,274. Row/townhouse unit sales are up 4%, 12 months to date. Row/townhouses have seen a increase by 6% in days on market. Average days to sell is 55 days. Lot sales volume is up 3%. Lot prices have increased by 3%, 12 months to date. Average lot sale price: $468,142.


Nanaimo

73 single-family homes sold. Average price: $852,702 (up 2% from 12 months to date, this year over last). Single-family unit sales volume is up 13%. Average days on market increased by 17% to 42 days. The average condo sold for $446,099. Condo unit sales are up 15%, 12 months to date. Condos have seen an increase of 14% in days on market. Average days to sell is 50 days. The average row/townhouse sold for $560,680. Row/townhouse unit sales increased by 0.5%, 12 months to date. Row/townhouses have seen a decrease by 9% in days on market. Average days to sell is 39 days. Lot sales volume is up 2%. Lot prices have decreased by 3%, 12 months to date. Average lot sale price: $546,214.


Parksville/Qualicum

34 single-family homes sold. Average price: $949,082 (down 3% from 12 months to date, this year over last). Single-family unit sales volume is up 10%. Average days on market has seen no change from 40 days. The average condo sold for $514,907. Condo unit sales have decreased by 23%, 12 months to date. Condos have seen a decrease by 12% in days on market. Average days to sell is 47 days. The average row/townhouse sold for $688,319. Row/townhouse unit sales are down 0.5%, 12 months to date. Row/townhouses have seen a increase by 26% in days on market. Average days to sell is 53 days. Lot sales volume is down 5%. Lot prices have decreased by 4%, 12 months to date. Average lot sale price: $534,850.


Cowichan Valley

63 single-family homes sold. Average price: $806,085 (up 1% from 12 months to date, this year over last). Single-family unit sales volume is up 17%. Average days on market increased by 10% to 52 days. The average condo sold for $351,488. Condo unit sales are  down 10%, 12 months to date. Condos have seen a increase of 23% in days on market. Average days to sell is 58 days. The average row/townhouse sold for $569,385. Row/townhouse unit sales have increased by 19%, 12 months to date. Row/townhouses have seen a decreased of 3% in days on market. Average days to sell is 62 days. Lot sales volume is down 24%. Lot prices have increased by 0.5%, 12 months to date. Average lot sale price: $459,424.


Leave a Reply

Message

Name

Phone*