Island Real Estate Trends and August 2024 Market Outlook

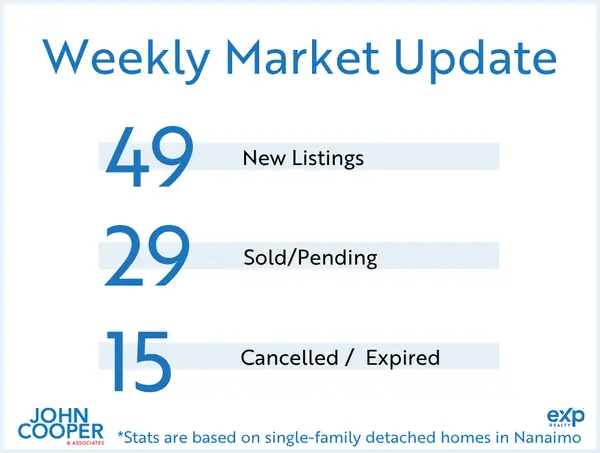
August is always an important month for statistical analysis. Sellers have received all of the market feedback from their attempts to sell in the spring and the inventory trends for the year are starting to solidify in a meaningful way. This week new single family residential listings increased from 43 last week to 52 this week. There was an increase in sales from 12 units last week to 18 units this week. The biggest differential this week was in the expired listings. This figure doubled from 20 units expiring last week to 43 units expiring this week. This is evidence that sellers are recalibrating their plans ahead of September. September is what I refer to as “second spring” as both buyers and sellers make one last push to make a move before the year ends and winter sets in.
If you are interested in learning what the market conditions are for your home, drop me an email and we can arrange for a conversation about your needs. Replies to this weekly email come directly to my personal inbox and I read and reply to every email I receive. I pride myself on my clients having direct contact and access to me.
John Cooper
250.619.9207
john@johncooper.ca
August 2024 Nanaimo Market Update

Most Recent Market Statistics (July 2024)*
Vancouver Island (not including Victoria)
363 single-family homes sold. Average price: $814,204 (up 3% from 12 months to date, this year over last). Single-family unit sales volume is down 8%. Average days on market decreased by 4% to 44 days. The average condo sold for $419,499. Condo unit sales are up 8%, 12 months to date. Condos have seen an increase by 4% in days on market. Average days to sell is 49 days. The average row/townhouse sold for $586,105. Row/townhouse unit sales are up 15%, 12 months to date. Row/townhouses have seen an increase by 14% in days on market. Average days to sell is 50 days. Lot sales volume is down 4%. Lot prices have increased by 9%, 12 months to date. Average lot sale price: $465,192. FULL REPORT HERE.
Nanaimo
102 single-family homes sold. Average price: $835,879 (up 3% from 12 months to date, this year over last). Single-family unit sales volume is down 1%. Average days on market decreased by 5% to 35 days. The average condo sold for $440,468. Condo unit sales are up 18%, 12 months to date. Condos have seen an increase by 14% in days on market. Average days to sell is 42 days. The average row/townhouse sold for $578,926. Row/townhouse unit sales are up 22%, 12 months to date. Row/townhouses have seen an increase by 13% in days on market. Average days to sell is 43 days. Lot sales volume is up 24%. Lot prices have increased by 7%, 12 months to date. Average lot sale price: $506,232. FULL REPORT HERE.
Parksville/Qualicum
59 single-family homes sold. Average price: $969,949 (up 5% from 12 months to date, this year over last). Single-family unit sales volume is down 3%. Average days on market decreased by 5% to 37 days. The average condo sold for $476,502. Condo unit sales are up 11%, 12 months to date. Condos have seen an increase by 23% in days on market. Average days to sell is 49 days. The average row/townhouse sold for $662,335. Row/townhouse unit sales are up 11%, 12 months to date. Row/townhouses have seen an increase by 8% in days on market. Average days to sell is 39 days. Lot sales volume is up 81%. Lot prices have increased by 1%, 12 months to date. Average lot sale price: $592,938. FULL REPORT HERE.
Cowichan Valley
65 single-family homes sold. Average price: $800,679 (up 3% from 12 months to date, this year over last). Single-family unit sales volume is down 12%. Average days on market decreased by 10% to 44 days. The average condo sold for $349,202. Condo unit sales are up 14%, 12 months to date. Condos have seen a decrease by 20% in days on market. Average days to sell is 43 days. The average row/townhouse sold for $575,507. Row/townhouse unit sales are up 2%, 12 months to date. Row/townhouses have seen a increase by 26% in days on market. Average days to sell is 63 days. Lot sales volume is down 15%. Lot prices have increased by 9%, 12 months to date. Average lot sale price: $437,837. FULL REPORT HERE.
Categories
Recent Posts