- Home
- Search
- Nanaimo Single Family Homes
- Nanaimo Condos
- Nanaimo Multi-Family Homes
- Nanaimo Manufactured Homes
- Nanaimo Vacant Land
- Nanaimo Mountian Views
- Nanaimo Ocean Views
- Nanaimo Ocean View Condos
- Nanaimo Waterfront Homes
- Nanaimo Income Properties
- Nanaimo Homes Under $750,000
- Nanaimo Homes Under $650,000
- Nanaimo Homes Under $550,000
- Nanaimo Foreclosures
- Nanaimo Price Reductions
- Nanaimo Sales
- Nanaimo Open Houses
- Communities
- Sell
- Buy
- Resources
- About
-
- Register
- Sign In
- Agent Emailjohn@johncooper.ca
- Agent Phone+1(250) 619-9207
Monthly Market Update:
January Newsletter 2025
January 2025 December 2024 was a busier month than expected and there is much optimism about the 2025 real estate market. Anecdotally, I have been meeting with many homeowners who are preparing to make a move. Homeowners who are early to market have a keen advantage and avoid the competition that inevitably arrives in May and June. I can assist you in making a detailed plan that ensures you don't leave any money on the table. Interested in Your Home's Value? The time for 2025 real estate planning is now! Email me for a personalized market assessment. I respond to every inquiry personally and prioritize open communication with my clients. I'm here to help! John Cooper250.619.9207john@johncooper.ca Most Recent Market Statistics (December 2024)* Vancouver Island (not including Victoria) 227 single-family homes sold. Average price: $816,362 (up 3% from 12 months to date, this year over last). Single-family unit sales volume hasn’t changed. Average days on market increased by 7% to 48 days. The average condo sold for $429,652. Condo unit sales are down 1%, 12 months to date. Condos have seen an increase by 13% in days on market. Average days to sell is 54 days. The average row/townhouse sold for $587,677. Row/townhouse unit sales are up 15%, 12 months to date. Row/townhouses have seen an increase by 24% in days on market. Average days to sell is 56 days. Lot sales volume is up 5%. Lot prices have decreased by 1%, 12 months to date. Average lot sale price: $444,463. FULL REPORT HERE.Nanaimo 61 single-family homes sold. Average price: $839,694 (up 2% from 12 months to date, this year over last). Single-family unit sales volume hasn’t changed. Average days on market increased by 11% to 39 days. The average condo sold for $443,069. Condo unit sales are up3%, 12 months to date. Condos have seen an increase by 32% in days on market. Average days to sell is 50 days. The average row/townhouse sold for $560,599. Row/townhouse unit sales are up 11%, 12 months to date. Row/townhouses have seen an increase by 13% in days on market. Average days to sell is 43 days. Lot sales volume is up 26%. Lot prices have increased by 42%, 12 months to date. Average lot sale price: $608,620. FULL REPORT HERE.Parksville/Qualicum 35 single-family homes sold. Average price: $964,815 (up 3% from 12 months to date, this year over last). Single-family unit sales volume is up 12%. Average days on market increased by 14% to 42 days. The average condo sold for $481,910. Condo unit sales are up 15%, 12 months to date. Condos have seen an increase by 38% in days on market. Average days to sell is 55 days. The average row/townhouse sold for $665,366. Row/townhouse unit sales are up 26%, 12 months to date. Row/townhouses have seen an increase by 21% in days on market. Average days to sell is 48 days. Lot sales volume hasn’t changed. Lot prices have decreased by 23%, 12 months to date. Average lot sale price: $508,182. FULL REPORT HERE.Cowichan Valley59 single-family homes sold. Average price: $792,698 (up 1% from 12 months to date, this year over last). Single-family unit sales volume is down 3%. Average days on market increased by 4% to 50 days. The average condo sold for $351,446. Condo unit sales are down 13%, 12 months to date. Condos have seen a decrease by 9% in days on market. Average days to sell is 48 days. The average row/townhouse sold for $565,963. Row/townhouse unit sales are up 3%, 12 months to date. Row/townhouses have seen an increase by 31% in days on market. Average days to sell is 67 days. Lot sales volume is down 7%. Lot prices have increased by 12%, 12 months to date. Average lot sale price: $452,347. FULL REPORT HERE.
Read MoreDecember Newsletter 2024
December 2024 The last 12 months have seen a modest reduction in interest rates, combined with a modest increase in housing inventory. This has led to balanced market conditions for most of 2024. Sellers waiting for prices to increase are being met with market resistance. Buyers waiting for prices to drop are seeing prices hold steady. It is my prediction that this trend will continue into 2025. Rates will continue to come down subtly, inventory will continue to increase subtly. Trading volume will continue to hold. Considering global macroeconomic factors, this is a positive outlook for 2025 in Central Vancouver Island. Interested in Your Home's Value? The time for 2025 real estate planning is now! Email me for a personalized market assessment. I respond to every inquiry personally and prioritize open communication with my clients. I'm here to help! John Cooper250.619.9207john@johncooper.ca December 2024 Nanaimo Market Update Most Recent Market Statistics (November 2024)* Vancouver Island (not including Victoria) 267 single-family homes sold. Average price: $816,466 (up 3% from 12 months to date, this year over last). Single-family unit sales volume is down 3%. Average days on market increased by 2% to 47 days. The average condo sold for $430,930. Condo unit sales are down 1%, 12 months to date. Condos have seen an increase by 10% in days on market. Average days to sell is 53 days. The average row/townhouse sold for $587,986. Row/townhouse unit sales are up 15%, 12 months to date. Row/townhouses have seen an increase by 20% in days on market. Average days to sell is 54 days. Lot sales volume is up 2%. Lot prices haveseen no change, 12 months to date. Average lot sale price: $445,520. FULL REPORT HERE. Nanaimo 69 single-family homes sold. Average price: $841,201 (up 3% from 12 months to date, this year over last). Single-family unit sales volume is down 3%. Average days on market increased by 6% to 38 days. The average condo sold for $446,750. Condo unit sales are up 3%, 12 months to date. Condos have seen an increase by 26% in days on market. Average days to sell is 48 days. The average row/townhouse sold for $563,577. Row/townhouse unit sales are up 10%, 12 months to date. Row/townhouses have seen an increase by 13% in days on market. Average days to sell is 43 days. Lot sales volume is up 18%. Lot prices have increased by 43%, 12 months to date. Average lot sale price: $613,161. FULL REPORT HERE. Parksville/Qualicum 47 single-family homes sold. Average price: $970,727 (up 5% from 12 months to date, this year over last). Single-family unit sales volume is up 7%. Average days on market increased by 11% to 41 days. The average condo sold for $489,791. Condo unit sales are up 19%, 12 months to date. Condos have seen an increase by 35% in days on market. Average days to sell is 54 days. The average row/townhouse sold for $667,917. Row/townhouse unit sales are up 26%, 12 months to date. Row/townhouses have seen an increase by 26% in days on market. Average days to sell is 44 days. Lot sales volume is up 3%. Lot prices have decreased by 21%, 12 months to date. Average lot sale price: $527,725. FULL REPORT HERE. Cowichan Valley 60 single-family homes sold. Average price: $792,812 (up 1% from 12 months to date, this year over last). Single-family unit sales volume is down 3%. Average days on market decreased by 2% to 48 days. The average condo sold for $350,771. Condo unit sales are down 9%, 12 months to date. Condos have seen a decrease by 15% in days on market. Average days to sell is 46 days. The average row/townhouse sold for $568,071. Row/townhouse unit sales are up 4%, 12 months to date. Row/townhouses have seen an increase by 27% in days on market. Average days to sell is 65 days. Lot sales volume is down 7%. Lot prices have increased by 19%, 12 months to date. Average lot sale price: $469,001. FULL REPORT HERE.
Read MoreNovember 2024 Nanaimo Market Update
November 2024 In my weekly review of sales statistics, I've consistently predicted a slow rise in inventory and steady prices since April 2024. As we approach the final weeks of the year, these predictions are proving accurate. Average sale prices have remained within a 3% margin of their starting point, and inventory has increased across all asset categories. Overall, the market remains balanced, with realistically priced homes selling within an average of 36 days, while overpriced homes linger. Declining interest rates have contributed to market stability, but haven't driven price increases—a trend I anticipate will persist. The forecast for the next 6 to 12 months is a stable, balanced market with minimal appreciation. If you are interested in learning what the market conditions are for your home, drop me an email and we can arrange for a conversation about your needs. Replies to this weekly email come directly to my personal inbox and I read and reply to every email I receive. I pride myself on my clients having direct contact and access to me.John Cooper250.619.9207john@johncooper.ca Most Recent Market Statistics (October 2024)* Vancouver Island (not including Victoria) 346 single-family homes sold. Average price: $817,034 (down 4% from 12 months to date, this year over last). Single-family unit sales volume is up 4%. Average days on market has seen no change and remain at 46 days. The average condo sold for $428,520. Condo unit sales are down 1%, 12 months to date. Condos have seen an increase by 6% in days on market. Average days to sell is 51 days. The average row/townhouse sold for $587,049. Row/townhouse unit sales are up 11%, 12 months to date. Row/townhouses have seen an increase by 18% in days on market. Average days to sell is 53 days. Lot sales volume is up 1%. Lot prices have increased by 4%, 12 months to date. Average lot sale price: $455,379. FULL REPORT HERE. Nanaimo 88 single-family homes sold. Average price: $837,950 (up 3% from 12 months to date, this year over last). Single-family unit sales volume is down 2%. Average days on market increased by 3% to 37 days. The average condo sold for $446,528. Condo unit sales are down 1%, 12 months to date. Condos have seen an increase by 18% in days on market. Average days to sell is 45 days. The average row/townhouse sold for $568,951. Row/townhouse unit sales are up 10%, 12 months to date. Row/townhouses have seen an increase by 13% in days on market. Average days to sell is 43 days. Lot sales volume is up 25%. Lot prices have increased by 35%, 12 months to date. Average lot sale price: $588,231. FULL REPORT HERE. Parksville/Qualicum 47 single-family homes sold. Average price: $983,847 (up 7% from 12 months to date, this year over last). Single-family unit sales volume is up 3%. Average days on market increased by 8% to 41 days. The average condo sold for $485,233. Condo unit sales are up 34%, 12 months to date. Condos have seen an increase by 33% in days on market. Average days to sell is 53 days. The average row/townhouse sold for $664,185. Row/townhouse unit sales are up 22%, 12 months to date. Row/townhouses have seen an increase by 22% in days on market. Average days to sell is 44 days. Lot sales volume is up 18%. Lot prices have decrease by 10%, 12 months to date. Average lot sale price: $550,771. FULL REPORT HERE. Cowichan Valley 62 single-family homes sold. Average price: $797,188 (up 2% from 12 months to date, this year over last). Single-family unit sales volume is down 6%. Average days on market decreased by 4% to 47 days. The average condo sold for $349,065. Condo unit sales are down 4%, 12 months to date. Condos have seen a decrease by 13% in days on market. Average days to sell is 46 days. The average row/townhouse sold for $568,823. Row/townhouse unit sales are down 9%, 12 months to date. Row/townhouses have seen an increase by 26% in days on market. Average days to sell is 63 days. Lot sales volume has seen no change. Lot prices have increased by 15%, 12 months to date. Average lot sale price: $465,272. FULL REPORT HERE.
Read MoreOctober Newsletter 2024
October 2024 The rate of new single-family residential listings has slowed since last week. 36 properties were listed this week, down from 47 last week. New single family sales have increased subtly from 10 last week to 12 this week. The biggest increase has been in the number of cancellations and expired listings, which have more than doubled in the last week from 23 last week to 59 this week. The next 10 weeks represent the last selling opportunity in 2024. Sales decrease substantially after December 15 and won't likely start to heat up again until March 2025. If you are interested in learning what the market conditions are for your home, drop me an email and we can arrange for a conversation about your needs. Replies to this weekly email come directly to my personal inbox and I read and reply to every email I receive. I pride myself on my clients having direct contact and access to me. John Cooper250.619.9207john@johncooper.ca Most Recent Market Statistics (October 2024) Vancouver Island (not including Victoria) 320 single-family homes sold. Average price: $818,693 (up 4% from 12 months to date, this year over last). Single-family unit sales volume is down 7%. Average days on market decreased by 2% to 45 days. The average condo sold for $423,434. Condo unit sales are down 2%, 12 months to date. Condos have seen an increase by 6% in days on market. Average days to sell is 51 days. The average row/townhouse sold for $584,915. Row/townhouse unit sales are up 10%, 12 months to date. Row/townhouses have seen an increase by 16% in days on market. Average days to sell is 52 days. Lot sales volume has seen no change. Lot prices have increased by 3%, 12 months to date. Average lot sale price: $456,350. FULL REPORT HERE. Nanaimo 76 single-family homes sold. Average price: $837,352 (up 3% from 12 months to date, this year over last). Single-family unit sales volume is down 6%. Average days on market has seen no change(36 days). The average condo sold for $445,560. Condo unit sales are up 1%, 12 months to date. Condos have seen an increase by 13% in days on market. Average days to sell is 44 days. The average row/townhouse sold for $571,940. Row/townhouse unit sales are up 5%, 12 months to date. Row/townhouses have seen an increase by 10% in days on market. Average days to sell is 43 days. Lot sales volume is up 21%. Lot prices have increased by 24%, 12 months to date. Average lot sale price: $575,647. FULL REPORT HERE. Parksville/Qualicum 60 single-family homes sold. Average price: $983,287 (up 7% from 12 months to date, this year over last). Single-family unit sales volume is up 2%. Average days on market decreased by 3% to 39 days. The average condo sold for $468,631. Condo unit sales are up 19%, 12 months to date. Condos have seen an increase by 38% in days on market. Average days to sell is 54 days. The average row/townhouse sold for $654,521. Row/townhouse unit sales are up 26%, 12 months to date. Row/townhouses have seen an increase by 20% in days on market. Average days to sell is 42 days. Lot sales volume is up 41%. Lot prices have decreased by 14%, 12 months to date. Average lot sale price: $555,292. FULL REPORT HERE. Cowichan Valley 63 single-family homes sold. Average price: $797,984 (up 2% from 12 months to date, this year over last). Single-family unit sales volume is down 11%. Average days on market decreased by 4% to 47 days. The average condo sold for $350,923. Condo unit sales are down 9%, 12 months to date. Condos have seen a decrease by 15% in days on market. Average days to sell is 47 days. The average row/townhouse sold for $572,668. Row/townhouse unit sales are down 13%, 12 months to date. Row/townhouses have seen an increase by 33% in days on market. Average days to sell is 64 days. Lot sales volume has seen no change. Lot prices have increased by 13%, 12 months to date. Average lot sale price: $456,957. FULL REPORT HERE.
Read MoreJohn Cooper Shares Market Insights in CHEK News Interview
In a recent interview with CHEK News, John Cooper discussed the current state of the Vancouver Island housing market. Joined by Vancouver Island Real Estate Board (VIREB) CEO Jason Yochim. John shared his unique perspective on why Central Vancouver Island remains resilient, even as other regions experience more volatility. Read the full story here.
Read MoreIsland Real Estate Trends and September 2024 Market Outlook
September 2024September is always an exciting time in the real estate market—what I like to call the “second spring.” After a summer of market fluctuations, we often see a surge of activity as both buyers and sellers aim to finalize their moves before winter sets in. This is a key month to pay attention to as trends solidify and the year's direction becomes clearer.If you are interested in learning what the market conditions are for your home, drop me an email and we can arrange for a conversation about your needs. Replies to this weekly email come directly to my personal inbox and I read and reply to every email I receive. I pride myself on my clients having direct contact and access to me. John Cooper250.619.9207john@johncooper.ca September 2024 Nanaimo Market Update Most Recent Market Statistics (August 2024)* Vancouver Island (not including Victoria) 333 single-family homes sold. Average price: $815,240 (up 4% from 12 months to date, this year over last). Single-family unit sales volume is down 8%. Average days on market decreased by 2% to 45 days. The average condo sold for $420,731. Condo unit sales are up 4%, 12 months to date. Condos have seen an increase by 4% in days on market. Average days to sell is 50 days. The average row/townhouse sold for $587,038. Row/townhouse unit sales are up 10%, 12 months to date. Row/townhouses have seen an increase by 13% in days on market. Average days to sell is 51 days. Lot sales volume is down 5%. Lot prices have increased by 7%, 12 months to date. Average lot sale price: $465,286. FULL REPORT HERE. Nanaimo 84 single-family homes sold. Average price: $833,390 (up 3% from 12 months to date, this year over last). Single-family unit sales volume is down 2%. Average days on market decreased by 3% to 36 days. The average condo sold for $444,840. Condo unit sales are up 12%, 12 months to date. Condos have seen an increase by 5% in days on market. Average days to sell is 42 days. The average row/townhouse sold for $578,720. Row/townhouse unit sales are up 10%, 12 months to date. Row/townhouses have seen an increase by 10% in days on market. Average days to sell is 43 days. Lot sales volume is up 13%. Lot prices have increased by 21%, 12 months to date. Average lot sale price: $567,842. FULL REPORT HERE. Parksville/Qualicum 50 single-family homes sold. Average price: $972,995 (up 5% from 12 months to date, this year over last). Single-family unit sales volume is down 5%. Average days on market decreased by 5% to 38 days. The average condo sold for $463,802. Condo unit sales are up 8%, 12 months to date. Condos have seen an increase by 31% in days on market. Average days to sell is 51 days. The average row/townhouse sold for $657,995. Row/townhouse unit sales are up 16%, 12 months to date. Row/townhouses have seen an increase by 14% in days on market. Average days to sell is 41 days. Lot sales volume is up 38%. Lot prices have decreased by 17%, 12 months to date. Average lot sale price: $543,977. FULL REPORT HERE. Cowichan Valley 58 single-family homes sold. Average price: $801,284 (up 3% from 12 months to date, this year over last). Single-family unit sales volume is down 14%. Average days on market decreased by 6% to 45 days. The average condo sold for $353,191. Condo unit sales are up 3%, 12 months to date. Condos have seen a decrease by 20% in days on market. Average days to sell is 44 days. The average row/townhouse sold for $575,175. Row/townhouse unit sales are down 8%, 12 months to date. Row/townhouses have seen an increase by 29% in days on market. Average days to sell is 63 days. Lot sales volume is down 1%. Lot prices have increased by 10%, 12 months to date. Average lot sale price: $447,857. FULL REPORT HERE.
Read MoreIsland Real Estate Trends and August 2024 Market Outlook
August 2024August is always an important month for statistical analysis. Sellers have received all of the market feedback from their attempts to sell in the spring and the inventory trends for the year are starting to solidify in a meaningful way. This week new single family residential listings increased from 43 last week to 52 this week. There was an increase in sales from 12 units last week to 18 units this week. The biggest differential this week was in the expired listings. This figure doubled from 20 units expiring last week to 43 units expiring this week. This is evidence that sellers are recalibrating their plans ahead of September. September is what I refer to as “second spring” as both buyers and sellers make one last push to make a move before the year ends and winter sets in.If you are interested in learning what the market conditions are for your home, drop me an email and we can arrange for a conversation about your needs. Replies to this weekly email come directly to my personal inbox and I read and reply to every email I receive. I pride myself on my clients having direct contact and access to me. John Cooper250.619.9207john@johncooper.ca August 2024 Nanaimo Market Update Most Recent Market Statistics (July 2024)* Vancouver Island (not including Victoria) 363 single-family homes sold. Average price: $814,204 (up 3% from 12 months to date, this year over last). Single-family unit sales volume is down 8%. Average days on market decreased by 4% to 44 days. The average condo sold for $419,499. Condo unit sales are up 8%, 12 months to date. Condos have seen an increase by 4% in days on market. Average days to sell is 49 days. The average row/townhouse sold for $586,105. Row/townhouse unit sales are up 15%, 12 months to date. Row/townhouses have seen an increase by 14% in days on market. Average days to sell is 50 days. Lot sales volume is down 4%. Lot prices have increased by 9%, 12 months to date. Average lot sale price: $465,192. FULL REPORT HERE. Nanaimo 102 single-family homes sold. Average price: $835,879 (up 3% from 12 months to date, this year over last). Single-family unit sales volume is down 1%. Average days on market decreased by 5% to 35 days. The average condo sold for $440,468. Condo unit sales are up 18%, 12 months to date. Condos have seen an increase by 14% in days on market. Average days to sell is 42 days. The average row/townhouse sold for $578,926. Row/townhouse unit sales are up 22%, 12 months to date. Row/townhouses have seen an increase by 13% in days on market. Average days to sell is 43 days. Lot sales volume is up 24%. Lot prices have increased by 7%, 12 months to date. Average lot sale price: $506,232. FULL REPORT HERE. Parksville/Qualicum 59 single-family homes sold. Average price: $969,949 (up 5% from 12 months to date, this year over last). Single-family unit sales volume is down 3%. Average days on market decreased by 5% to 37 days. The average condo sold for $476,502. Condo unit sales are up 11%, 12 months to date. Condos have seen an increase by 23% in days on market. Average days to sell is 49 days. The average row/townhouse sold for $662,335. Row/townhouse unit sales are up 11%, 12 months to date. Row/townhouses have seen an increase by 8% in days on market. Average days to sell is 39 days. Lot sales volume is up 81%. Lot prices have increased by 1%, 12 months to date. Average lot sale price: $592,938. FULL REPORT HERE. Cowichan Valley 65 single-family homes sold. Average price: $800,679 (up 3% from 12 months to date, this year over last). Single-family unit sales volume is down 12%. Average days on market decreased by 10% to 44 days. The average condo sold for $349,202. Condo unit sales are up 14%, 12 months to date. Condos have seen a decrease by 20% in days on market. Average days to sell is 43 days. The average row/townhouse sold for $575,507. Row/townhouse unit sales are up 2%, 12 months to date. Row/townhouses have seen a increase by 26% in days on market. Average days to sell is 63 days. Lot sales volume is down 15%. Lot prices have increased by 9%, 12 months to date. Average lot sale price: $437,837. FULL REPORT HERE.
Read MoreIsland Real Estate Trends and July 2024 Market Outlook
July 2024 It has been a busy spring market, however, statistically sales are down from 2023 and inventory is rising. Prices are holding steady and that is expected to continue unless we continue to see inventory rise. Summer in Vancouver Island typically sees new listing inventory slow down. I did an absorption rate analysis for Single Family homes in Nanaimo with at least 3 bedrooms and 2 bathrooms priced between $600,000 and $1,200,000. There are currently 271 active listings that fit that description. 262 have sold in the last 6 months which equates to 43 sales per month. This means we have 6.3 months of inventory. This is at the very top of balanced markets, touching ever so slightly into a buyers market. I will be watching this closely and will report on it in our upcoming weekly and monthly reports.If you are a homeowner who is curious about your home’s value please reach out by replying to this email and setting up an appointment with me for a Free Property Valuation Report. If you are interested in potentially buying a home in Central Vancouver Island, I am taking appointments for Free Buyer Consultations. These consultations will empower you with the knowledge to make an informed decision as you navigate the local real estate market. John Cooper250.619.9207john@johncooper.ca July 2024 Nanaimo Market Update Most Recent Market Statistics (June 2024)* Vancouver Island (not including Victoria) 359 single-family homes sold. Average price: $815,424 (up 3% from 12 months to date, this year over last). Single-family unit sales volume is down 3%. Average days on market decreased by 4% to 43 days. The average condo sold for $414,239. Condo unit sales are up 13%, 12 months to date. Condos have seen an increase by 11% in days on market. Average days to sell is 49 days. The average row/townhouse sold for $585,742. Row/townhouse unit sales are up 18%, 12 months to date. Row/townhouses have seen an increase by 7% in days on market. Average days to sell is 48 days. Lot sales volume is up 7%. Lot prices have increased by 5%, 12 months to date. Average lot sale price: $451,321. FULL REPORT HERE. Nanaimo 103 single-family homes sold. Average price: $841,330 (up 3% from 12 months to date, this year over last). Single-family unit sales volume is up 4%. Average days on market decreased by 5% to 35 days. The average condo sold for $431,907. Condo unit sales are up 18%, 12 months to date. Condos have seen an increase by 14% in days on market. Average days to sell is 41 days. The average row/townhouse sold for $580,586. Row/townhouse unit sales are up 33%, 12 months to date. Row/townhouses have seen an increase by 8% in days on market. Average days to sell is 42 days. Lot sales volume is up 19%. Lot prices have decreased by 3%, 12 months to date. Average lot sale price: $484,253. FULL REPORT HERE. Parksville/Qualicum 57 single-family homes sold. Average price: $974,164 (up 6% from 12 months to date, this year over last). Single-family unit sales volume is down 5%. Average days on market decreased by 3% to 37 days. The average condo sold for $465,666. Condo unit sales are up 7%, 12 months to date. Condos have seen an increase by 44% in days on market. Average days to sell is 46 days. The average row/townhouse sold for $669,270. Row/townhouse unit sales are up 2%, 12 months to date. Row/townhouses have seen a decreased by 6% in days on market. Average days to sell is 34 days. Lot sales volume is up 84%. Lot prices have increased by 6%, 12 months to date. Average lot sale price: $594,986. FULL REPORT HERE. Cowichan Valley 53 single-family homes sold. Average price: $797,479 (up 2% from 12 months to date, this year over last). Single-family unit sales volume is down 5%. Average days on market decreased by 6% to 44 days. The average condo sold for $340,200. Condo unit sales are up 28%, 12 months to date. Condos have seen no change in days on market. Average days to sell is 49 days. The average row/townhouse sold for $577,136. Row/townhouse unit sales are up 10%, 12 months to date. Row/townhouses have seen an increase by 26% in days on market. Average days to sell is 62 days. Lot sales volume is up 1%. Lot prices have increased by 5%, 12 months to date. Average lot sale price: $426,603. FULL REPORT HERE. *waterfront homes are not included in the monthly statistics
Read MoreIsland Real Estate Trends and June 2024 Market Outlook
June 202412 months to date sales are up, but so is inventory. Month-over-month sales are down. What should we expect to see moving forward? I am predicting subtle downward pressure on pricing, a subtle increase in available inventory, and stable demand. It's back to real estate fundamentals. Sellers need to price to the market, & respond to market feedback and buyers need to think long-term, be discerning and do their due diligence.If you are a homeowner who is curious about your home’s value please reach out by replying to this email and setting up an appointment with me for a Free Property Valuation Report. If you are interested in potentially buying a home in Central Vancouver Island, I am taking appointments for Free Buyer Consultations. These consultations will empower you with the knowledge to make an informed decision as you navigate the local real estate market. John Cooper250.619.9207john@johncooper.ca June 2024 Nanaimo Market Update Most Recent Market Statistics (May 2024)* Vancouver Island (not including Victoria) 400 single-family homes sold. Average price: $814,369 (up 3% from 12 months to date, this year over last). Single-family unit sales volume is down 1%. Average days on market decreased by 2% to 43 days. The average condo sold for $414,795. Condo unit sales are up 21%, 12 months to date. Condos have seen an increase by 14% in days on market. Average days to sell is 48 days. The average row/townhouse sold for $581,912. Row/townhouse unit sales are up 25%, 12 months to date. Row/townhouses have seen an increase by 9% in days on market. Average days to sell is 47 days. Lot sales volume is up 15%. Lot prices have increased by 6%, 12 months to date. Average lot sale price: $458,269. FULL REPORT HERE. Nanaimo 100 single-family homes sold. Average price: $843,663 (up 3% from 12 months to date, this year over last). Single-family unit sales volume is up 5%. Average days on market decreased by 6% to 34 days. The average condo sold for $438 257. Condo unit sales are up 29%, 12 months to date. Condos have seen an increase by 11% in days on market. Average days to sell is 39 days. The average row/townhouse sold for $575,629. Row/townhouse unit sales are up 48%, 12 months to date. Row/townhouses have seen an increase by 5% in days on market. Average days to sell is 42 days. Lot sales volume is up 30%. Lot prices have decreased by 5%, 12 months to date. Average lot sale price: $471,292. FULL REPORT HERE. Parksville/Qualicum 61 single-family homes sold. Average price: $970,848 (up 6% from 12 months to date, this year over last). Single-family unit sales volume is down 4%. Average days on market remains at 37 days. The average condo sold for $454,446. Condo unit sales are up 11%, 12 months to date. Condos have seen an increase by 45% in days on market. Average days to sell is 45 days. The average row/townhouse sold for $666,348. Row/townhouse unit sales are down 5%, 12 months to date. Row/townhouses have seen an increase by 13% in days on market. Average days to sell is 36 days. Lot sales volume is up 63%. Lot prices have increased by 15%, 12 months to date. Average lot sale price: $615,556. FULL REPORT HERE. Cowichan Valley 83 single-family homes sold. Average price: $799,798 (up 3% from 12 months to date, this year over last). Single-family unit sales volume is up 3%. Average days on market remain at 45 days. The average condo sold for $337,550. Condo unit sales are up 40%, 12 months to date. Condos have seen an increase by 11% in days on market. Average days to sell is 50 days. The average row/townhouse sold for $576,672. Row/townhouse unit sales are up 32%, 12 months to date. Row/townhouses have seen an increase by 27% in days on market. Average days to sell is 57 days. Lot sales volume is up 19%. Lot prices have increased by 1%, 12 months to date. Average lot sale price: $438,226. FULL REPORT HERE. *waterfront homes are not included in the monthly statistics
Read MoreIsland Real Estate Trends and May 2024 Market Outlook
May 2024Spring 2024 is outperforming 2023 by every conceivable metric. Sales are up, inventory is up, rates are holding and consumer sentiment is up. This is good news for Vancouver Island. “Slow and steady, wins the race” and slow and steady has consistently been a trend in the Central Vancouver Island real estate market. 2019 to 2022 were anomalies for this market and I am happy to see that volatility subside. The market we are experiencing now is a healthy and sustainable market wherein buyers and sellers have reciprocal leverage and are able to make sound and informed decisions. Don’t be fooled. This is a balanced and healthy market.If you are a homeowner who is curious about your home’s value please reach out by replying to this email and setting up an appointment with me for a Free Property Valuation Report. If you are interested in potentially buying a home in Central Vancouver Island, I am taking appointments for Free Buyer Consultations. These consultations will empower you with the knowledge to make an informed decision as you navigate the local real estate market. John Cooper250.619.9207john@johncooper.ca May 2024 Nanaimo Market Update Most Recent Market Statistics (April 2024)* Vancouver Island (not including Victoria) 376 single-family homes sold. Average price: $811,313 (up 1% from 12 months to date, this year over last). Single-family unit sales volume is up 2%. Average days on market increased by 5% to 43 days. The average condo sold for $418,288. Condo unit sales are up 19%, 12 months to date. Condos have seen an increase by 23% in days on market. Average days to sell is 48 days. The average row/townhouse sold for $583,261. Row/townhouse unit sales are up 21%, 12 months to date. Row/townhouses have seen an increase by 21% in days on market. Average days to sell is 47 days. Lot sales volume is up 25%. Lot prices have decreased by 13%, 12 months to date. Average lot sale price: $455,780. FULL REPORT HERE. Nanaimo 109 single-family homes sold. Average price: $840,784 (up 2% from 12 months to date, this year over last). Single-family unit sales volume is up 4%. Average days on market decreased by 3% to 33 days. The average condo sold for $442,436. Condo unit sales are up 23%, 12 months to date. Condos have seen an increase by 15% in days on market. Average days to sell is 38 days. The average row/townhouse sold for $581,307. Row/townhouse unit sales are up 44%, 12 months to date. Row/townhouses have seen an increase by 8% in days on market. Average days to sell is 41 days. Lot sales volume is up 27%. Lot prices have decreased by 15%, 12 months to date. Average lot sale price: $470,296. FULL REPORT HERE. Parksville/Qualicum 64 single-family homes sold. Average price: $960,874 (up 4% from 12 months to date, this year over last). Single-family unit sales volume is down 1%. Average days on market increased by 6% to 37 days. The average condo sold for $473,675. Condo unit sales are up 13%, 12 months to date. Condos have seen an increase by 61% in days on market. Average days to sell is 45 days. The average row/townhouse sold for $692,012. Row/townhouse unit sales are down 15%, 12 months to date. Row/townhouses have seen an increase by 16% in days on market. Average days to sell is 36 days. Lot sales volume is up 59%. Lot prices have increase by 16%, 12 months to date. Average lot sale price: $612,678. FULL REPORT HERE. Cowichan Valley 62 single-family homes sold. Average price: $800,681 (up 1% from 12 months to date, this year over last). Single-family unit sales volume is up 3%. Average days on market increased by 10% to 45 days. The average condo sold for $333,810. Condo unit sales are up 34%, 12 months to date. Condos have seen an increase by 21% in days on market. Average days to sell is 52 days. The average row/townhouse sold for $576,784. Row/townhouse unit sales are up 24%, 12 months to date. Row/townhouses have seen an increase by 36% in days on market. Average days to sell is 57 days. Lot sales volume is up 18%. Lot prices have decreased by 21%, 12 months to date. Average lot sale price: $437,063. FULL REPORT HERE. *waterfront homes are not included in the monthly statistics Unlocking Property Ownership: What you need to know Fact: If you own a home in Canada, you don't actually own the land. Put simply, you own the bundle of rights attached to that land, as long as you continue to pay your taxes. Accurately determining a property's value requires an understanding of these rights. These rights are determined by the zoning and any other legal instruments registered on the title. We then use one of 3 valuation models to determine value. The Comparative Market Approach is used when evaluating residential real estate. If you are looking for an accurate valuation of your property, and live in the Nanaimo region, I can help. Reach out and book an appointment to receive a Free Property Valuation Report. #johncooper #realestate #growth #accountability #love #kindness Define Your Own Success: Letting go of Comparison in Real Estate and Life Comparison is the thief of joy. 🙏❤️When we define our success relative to others we hand the key to our happiness to a metric that we no longer get to define for ourselves. This loss of control increases our stress and anxiety. This increase in stress and anxiety overflows into our relationships with our loved ones and the relationships we have with ourselves. The real estate trading industry is one of the worst modern industries for these comparisons. For almost a decade I let this mindset of constant comparison rob me of my contentment. It negatively impacted my relationships and my health. Take your power back and define success for yourself. Do not let Gross Commission Income rankings impact your self-worth. It's a mistake. Success is defined by our health, our relationships, and our gratitude. Finding Your Perfect Home: Balancing Emotion and Investment with John Cooper, Real Estate Advisor ❤️🏡 Important considerations when purchasing a home. Purchasing a home is one of the biggest decisions you will make in your lifetime. The average Canadian lives in their home for 6 years and many will live in their homes for several decades. It is an intensely emotional decision. Our home is the stage for many of our lives greatest memories. I have viewed thousands of homes over the last 16 years as an advisor and it is clear to me that the ideal home for you is one that gives you a certain feeling. You just feel it when you are inside a home that is right for you. It's important to acknowledge these emotions. That said, it's your advisor's role to make sure that your emotions aren't getting in the way of a sound investment decision. It's your advisor's role to make sure that you are keenly aware of what the limitations may be should you decide to sell the home in the future. I call this 'future liquidity' and its an important consideration. I've witnessed emotions get in the way of a wise decision many times and as hard as it can be at times, it is my fiduciary duty to educate my clients to all of the features of a home; both good and bad. It is ok to let your emotions make the final call, as long as all the important details have been factored. #johncooper #realestate #growth #accountability #love #kindness ❤️
Read MoreIsland Real Estate Trends and April 2024 Market Outlook
April 2024Inventory is on the rise, demand is steady and prices are holding firm. The Vancouver Island Real Estate Market is entering the most active 12 weeks of the year. It is expected that 2024 will outperform 2023. Consumer confidence has been improving with some modest reductions in interest rates. I am predicting additional modest rate reductions as we head into the back half of summer. I will be watching inventory levels closely to see if the spring inventory is being met with consistent buyer demand. We should know if inventory is going to increase or decrease by August. This will dictate which way prices are likely to go. If you are a homeowner who is curious about your home’s value please reach out by replying to this email and setting up an appointment with me for a Free Property Valuation Report. If you are interested in potentially buying a home in Central Vancouver Island, I am taking appointments for Free Buyer Consultations. These consultations will empower you with the knowledge to make an informed decision as you navigate the local real estate market. John Cooper250.619.9207john@johncooper.ca Stay Ahead: Watch the April 2024 Nanaimo Market Update Now! Most Recent Market Statistics (March 2024)* Vancouver Island (not including Victoria) 291 single family homes sold. Average price: $807,409 (down 1% from 12 months to date, this year over last). Single-family unit sales volume is down 1%. Average days on market increased by 16% to 44 days. The average condo sold for $417,823. Condo unit sales are up 14%, 12 months to date. Condos have seen a 33% increase in days on market. Average days to sell is 48 days. The average row/townhouse sold for $580,981. Row/townhouse unit sales are up 19% 12 months to date. Row/townhouses have seen a 25% increase in days on market. Average days to sell is 45 days. Lot sales volume is up 20%. Lot prices have decreased by 13%, 12 months to date. Average lot sale price: $445,327. FULL REPORT HERE. Nanaimo 88 single-family homes sold. Average price: $840,208 (down 1% 12 months to date, this year over last). Single-family unit sales volume is down 3%. Average days on market has increased by 10% to 38 days. The average condo sold for $441. Condo unit sales are up 9%, 12 months to date. Condos have seen a 31% increase in days on market. Average days to sell is 38 days. The average row/townhouse sold for $578,083 Row/townhouse unit sales are up 36% 12 months to date. Row/townhouses have seen a 21% increase in days on market. Average days to sell is 40 days. Lot sales volume is up by 20%. Lot prices have decreased 23%, 12 months to date. Average lot sale price: $448,816. FULL REPORT HERE. Parksville/Qualicum 37 single-family homes sold. Average price: $955,419 (up 1% from 12 months to date, this year over last). Single-family unit sales volume is down 5%. Average days on market increased by 15% to 38 days. The average condo sold for $469,633. Condo unit sales are up 22%, 12 months to date. Condos have seen a 69% increase in days on market. Average days to sell is 44 days. The average row/townhouse sold for $687,065. Row/townhouse unit sales are down 10% 12 months to date. Row/townhouses have seen a 6% increase in days on market. Average days to sell is 33 days. Lot sales volume is up 100%. Lot prices have increased by 7%, 12 months to date. Average lot sale price: $600,116. FULL REPORT HERE. Cowichan Valley 59 single-family homes sold. Average price: $794,616 (down 2% from 12 months to date, this year over last). Single-family unit sales volume is up 6%. Average days on market increased by 28% to 46 days. The average condo sold for $333,771. Condo unit sales are up 19%, 12 months to date. Condos have seen a 24% increase in days on market. Average days to sell is 51 days. The average row/townhouse sold for $569,668. Row/townhouse unit sales are up 42% 12 months to date. Row/townhouses have seen a 61% increase in days on market. Average days to sell is 58 days. Lot sales volume is down 22%. Lot prices have decreased by 23%, 12 months to date. Average lot sale price: $430,821. FULL REPORT HERE. *waterfront homes are not included in the monthly statistics Unlocking Consistent Success in Real Estate: The Power of Competence Over Time What does it take to find consistent success as a real estate advisor? How do you work to overcome the ebb and flow of the macroeconomic influences in real estate? What can you take daily action on to build a business that you can rely on and build a stable future around? Most coaches and experts have a lot to say about lead generation and conversion scripts, but I think these influencers miss the most critical element to growing a career for the long term...competence. Serving your clients with an extremely high level of competence over time separates the agents that have succeeded from being in the "right place at the right time" from the agents that make up the top tier of advisors in every market in existence. Knowing how to develop and nurture new businesses is important, but if those clients are not witnessing a level of competence worthy of their accolades, your business will not grow over time. Your career will feel like being on a treadmill, instead of climbing a mountain. You can have it in you! But you need to do the work. ❤️❤️❤️#johncooper #growth #accountability #love #kindness #realestate Beyond Wealth: The True Currency of Happiness Revealed Does money buy happiness? According to a recent study it does. But it can only get you so far. A recent study, discussed on @lewishowes School of Greatness Podcast, with @chrisandersonted of @ted, the act of giving to others can increase reported happiness equivalent to a doubling of your wealth! That's incredible. Think about how hard we have to work to double our wealth! Now think about all the ways in which we can give to others! What comes to mind for you for ways that you can create happiness? Maximize Your Home's Value: Why Multiple Expert Opinions Are Crucial Before Selling! Save Money on Commissions is a compelling offer. However, selling your home for substantially less than it is worth is a very expensive mistake! To avoid this, you need to speak with multiple experts to collect opinions of value. Do not rely on your tax assessment for value. They are not accurate. Multiple expert opinions are the best way to ensure you are not leaving money on the table. Many homeowners do not have an accurate idea as to their home's value and often estimate it lower than reality. Test your assumptions with multiple opinions before committing to anything. If you are in the Nanaimo, Ladysmith, or Central Vancouver Island area we can assist. #johncooper #realestate #growth #accountability #love #kindness The Art of Advising: The Vital Skills of Active Listening and Creative Problem Solving I had a great experience today with a Doctor and it got me thinking about what makes a great advisor. It is clear that efficiency and volume are not on the list of characteristics of a great advisor. In my mind, their character and level of care are critical and this is often demonstrated through their ability to engage in 2 important skills. 1. Active Listening and 2. Creative Problem Solving. #johncooper #growth #accountability #love #kindness ❤️
Read MoreIsland Real Estate Trends and March 2024 Market Outlook
March 2024Are you ready for Spring 2024!? Don't let this week's snowfall mislead you, we are stepping into what looks to be a busy spring real estate market. We have seen a big increase in buyer activity compared to this time last year as well as an increase in new listings coming to market. Some asset categories have seen a 25% increase in new inventory compared to February 2023. If you are looking to start working on a real estate plan, this is a good time of year to get started. One of the biggest mistakes I see is homeowners wanting to get their homes in perfect condition BEFORE they bring me through for a consultation. This is not ideal. Their mindset is that they think I am going to appraise their home higher, but what I most often find is that they have misdirected their resources and wasted valuable time on the wrong improvements. By bringing me in sooner, we can focus our effort on the high-value items and maximize our market timing opportunities. The timing of my evaluation will have no impact on the results of the Property Valuation Report. I conduct the report on the assumption that the items we review together are addressed. If you want to schedule me to provide you with a Property Valuation Report, simply call me or reply to this email and we can set it up. I hope you enjoy this month's market report.John Cooper250.619.9207john@johncooper.ca March 2024 Nanaimo Market Update Most Recent Market Statistics (January 2024)* Vancouver Island (not including Victoria) 254 single family homes sold. Average price: $801,169 (down 4% from 12 months to date, this year over last). Single-family unit sales volume is down 3%. Average days on market increased by 36% to 45 days. The average condo sold for $416,267. Condo unit sales are down 4%, 12 months to date. Condos have seen a 55% increase in days on market. Average days to sell is 48 days. The average row/townhouse sold for $580,513. Row/townhouse unit sales are up 14% 12 months to date. Row/townhouses have seen a 44% increase in days on the market. Average days to sell is 46 days. Lot sales volume is up 5%. Lot prices have decreased by 14%, 12 months to date. Average lot sale price: $454,601. FULL REPORT HERE. Nanaimo 66 single family homes sold. Average price: $831,957 (down 5% 12 months to date, this year over last). Single family unit sales volume is down 6%. Average days on market has increased by 30% to 35 days. The average condo sold for $445,817. Condo unit sales are up 1%, 12 months to date. Condos have seen a 41% increase in days on market. Average days to sell is 38 days. The average row/townhouse sold for $573,065 Row/townhouse unit sales are up 20% 12 months to date. Row/townhouses have seen a 38% increase in days on market. Average days to sell is 40 days. Lot sales volume is down by 2%. Lot prices have decreased by 25%, 12 months to date. Average lot sale price: $472,518. FULL REPORT HERE. Parksville/Qualicum 46 single family homes sold. Average price: $941,783 (down 2% from 12 months to date, this year over last). Single-family unit sales volume is down 5%. Average days on market increased by 31% to 38 days. The average condo sold for $457,551. Condo unit sales are down 5%, 12 months to date. Condos have seen a 144% increase in days on market. Average days to sell is 44 days. The average row/townhouse sold for $691,762. Row/townhouse unit sales are down 10% 12 months to date. Row/townhouses have seen a 26% increase in days on market. Average days to sell is 34 days. Lot sales volume is up 5%. Lot prices have increased by 4%, 12 months to date. Average lot sale price: $618,568. FULL REPORT HERE. Cowichan Valley 51 single family homes sold. Average price: $793,710 (down 4% from 12 months to date, this year over last). Single-family unit sales volume is up 1%. Average days on market increased by 47% to 47 days. The average condo sold for $335,142. Condo unit sales are down 7%, 12 months to date. Condos have seen a 44% increase in days on market. Average days to sell is 52 days. The average row/townhouse sold for $568,342. Row/townhouse unit sales are up 27% 12 months to date. Row/townhouses have seen a 90% increase in days on market. Average days to sell is 57 days. Lot sales volume is down 9%. Lot prices have decreased by 30%, 12 months to date. Average lot sale price: $413,490. FULL REPORT HERE. *waterfront homes are not included in the monthly statistics Embrace the Now: Seizing Life's Opportunities with John Cooper "You don't know what you got til' it's gone." Life has a way of teaching us hard lessons in making the most of our time. As a real estate advisor, I spend a lot of time with people going through major life moments and the takeaways are clear. We tend to regret the things we DIDN'T do, far more than the things we DID do. Speaking personally I know my biggest regrets are in the moments I was overthinking wherein action was the solution. When contemplating big decisions around your time, I encourage you to err on the side of DOING IT. The universe is trying to show you where your heart wants to go and it is in your best interests to follow your instincts. The best time to take action in alignment with your heart is now. Take the trip, make the move, share the love, prioritize health, and do all the things. The time is now. #growth #accountability #love #kindness #findyourvoice #dontbeacoverband Mastering the Move: Homeowner Considerations for Buying and Selling Homeowner considerations when buying and selling your home. Do you buy first? Do you sell first? How do I find a home and reserve it before I sell my home? How do I avoid owning 2 homes at the same time? There are so many moving parts when making a move, and it all starts with getting an accurate picture of what your home is worth. Then you need to determine what financial tools are available to you, followed by a look into your options. Lastly, you need to get an idea as to the specific supply and demand considerations and factor in your risk tolerance. It's a lot! In this video, I attempt to distill the key considerations from our homeowner consultations. These consultations are in-depth and can be booked by reaching out to me directly. There is no charge for the initial consultation and it is a very valuable opportunity to make a thoughtful plan before you get in over your head. #johncooper #realestate #growth #accountability #love #kindness Embracing Love & Kindness: Our Commitment to You in Real Estate Decision-Making February is the month to celebrate Love. Love & Kindness - One of our Core Commitments. When we set out to identify the 3 core commitments for John Cooper & Associates, we wanted to find a way to capture how we aim to show up when we meet with our clients. Love and kindness speak to the idea that we treat our clients like family. When we help guide our clients to great real estate decisions, we want to imagine we are advising someone whom we care for like family. As an advisor, it is critical that our guidance not be contaminated with self-interests or greed. We love what we do and we hope that our love for real estate advising is always obvious. We honour the opportunity to assist you in your real estate decision, we are grateful for the opportunity to build a relationship with you and we desire to always demonstrate kindness in our interactions. This is our commitment to Love & Kindness. #johncooper #realestate #love #kindness #accountability #growth
Read MoreIsland Real Estate Trends and February 2024 Market Outlook
February 2024It’s February and love is in the air! I love this month as it marks the beginning of the 2024 real estate season. February is a formative month for the critical spring real estate season. March, April, May & June are typically the highest trading volume months in the year so, for me, February is time to load test the systems and get engaged for the important months ahead. To that end, we have already seen an increase in listing activity and showing activity and this is expected to continue for the foreseeable future. If you have a real estate decision you are considering, now is the time to reach out, while we have time on our side. I am happy to talk to you about it. No sales pressure. No tactics. Just helpful guidance to move you forward. Reach out to me personally anytime and for any reason. John Cooper250.619.9207john@johncooper.ca February 2024 Nanaimo Market Update To watch the February 2024 Market Update, click the video window below! Most Recent Market Statistics (January 2024)* Vancouver Island (not including Victoria) 152 single family homes sold. Average price: $798,474 (down 5% from 12 months to date, this year over last). Single-family unit sales volume is down 7%. Average days on market increased by 50% to 45 days. The average condo sold for $410,998. Condo unit sales are down 2%, 12 months to date. Condos have seen a 66% increase in days on market. Average days to sell is 48 days. The average row/townhouse sold for $575,515. Row/townhouse unit sales are up 7% 12 months to date. Row/townhouses have seen a 45% increase in days on market. Average days to sell is 45 days. Lot sales volume is down 20%. Lot prices have increased by 3%, 12 months to date. Average lot sale price: $633,036. FULL REPORT HERE. Nanaimo 40 single family homes sold. Average price: $829,064 (down 6% 12 months to date, this year over last). Single family unit sales volume is down 10%. Average days on market has increased by 40% to 35 days. The average condo sold for $442,171. Condo unit sales are down 7%, 12 months to date. Condos have seen a 52% increase in days on market. Average days to sell is 38 days. The average row/townhouse sold for $571,825 Row/townhouse unit sales are up 6% 12 months to date. Row/townhouses have seen a 36% increase in days on market. Average days to sell is 38 days. Lot sales volume is down by 25%. Lot prices have decreased by 39%, 12 months to date. Average lot sale price: $446,019. FULL REPORT HERE. Parksville/Qualicum 28 single family homes sold. Average price: $934,165 (down 4% from 12 months to date, this year over last). Single-family unit sales volume is down 10%. Average days on market increased by 42% to 37 days. The average condo sold for $452,952. Condo unit sales are down 5%, 12 months to date. Condos have seen a 147% increase in days on market. Average days to sell is 42 days. The average row/townhouse sold for $676,397. Row/townhouse unit sales are down 6% 12 months to date. Row/townhouses have seen a 38% increase in days on market. Average days to sell is 33 days. Lot sales volume is down 20%. Lot prices have increased by 3%, 12 months to date. Average lot sale price: $633,036. FULL REPORT HERE. Cowichan Valley 23 single family homes sold. Average price: $791,086 (down 5% from 12 months to date, this year over last). Single-family unit sales volume is down 5%. Average days on market increased by 62% to 47 days. The average condo sold for $332,849. Condo unit sales are down 8%, 12 months to date. Condos have seen a 56% increase in days on market. Average days to sell is 50 days. The average row/townhouse sold for $565,019. Row/townhouse unit sales are up 6% 12 months to date. Row/townhouses have seen an 93% increase in days on market. Average days to sell is 56 days. Lot sales volume is down 3%. Lot prices have decreased by 31%, 12 months to date. Average lot sale price: $407,496. FULL REPORT HERE. *waterfront homes are not included in the monthly statistics
Read MoreIsland Real Estate Trends and January 2024 Market Outlook
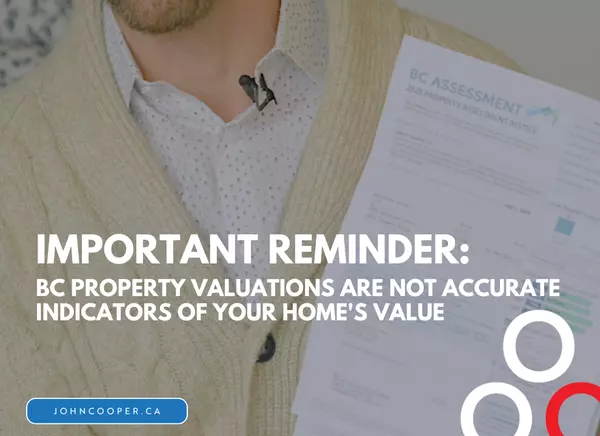
Happy New Year! ❤️ 2023 has come to an end and we now set our sights on 2024. Looking back, 2023 started out with a lot of uncertainty. I recall being very nervous about how the real estate market was going to perform. As it turned out, we had some bumps and bruises, but overall it could have been much worse. Prices came down about 10% but recovered 3% of that loss in the last quarter. Resulting in a 7% reduction in values. That is not terrible considering the record-breaking gains we had in the previous 4 years. As we head into 2024 there is much optimism about what the future holds. Many experts are forecasting interest rates to decline by summer and this is expected to reignite the appetite of Canadians to start investing in real estate again. We are still experiencing relatively low inventory levels which should mitigate further value losses. For homeowners wondering which way their values are headed, I would count on values to range in the minus 3% to plus 6% range. When we run the numbers in my planning consultations I factor values staying the same as a default. For those considering entering the market, I am focusing our consultation on clearly identifying their needs and putting contingency plans in place to ensure that my clients can weather any potential storm. Buyers that play the long game win. If you have a real estate decision in front of you or want to plan to mitigate your risk exposure, call me. I am happy to talk to you about it. No sales pressure. No tactics. Just helpful guidance to move you forward. Reach out to me personally anytime and for any reason. John Cooper250.619.9207john@coopergroup.ca January 2024 Nanaimo Market Update To watch the January 2024 Market Update, click the video window below! Most Recent Market Statistics (December 2023)* Vancouver Island (not including Victoria) 151 single family homes sold. Average price: $796,146 (down 6% from 12 months to date, this year over last). Single-family unit sales volume is down 8%. Average days on market increased by 59% to 46 days. The average condo sold for $409,380. Condo unit sales are down 7%, 12 months to date. Condos have seen a 78% increase in days on market. Average days to sell is 48 days. The average row/townhouse sold for $573,486. Row/townhouse unit sales are up 3% 12 months to date. Row/townhouses have seen a 55% increase in days on market. Average days to sell is 45 days. Lot sales volume is down 18%. Lot prices have decreased by 18%, 12 months to date. Average lot sale price: $450,412. FULL REPORT HERE. Nanaimo 45 single family homes sold. Average price: $827,617 (down 7% 12 months to date, this year over last). Single family unit sales volume is down 11%. Average days on market has increased by 50% to 36 days. The average condo sold for $441,847. Condo unit sales are down 15%, 12 months to date. Condos have seen a 65% increase in days on market. Average days to sell is 38 days. The average row/townhouse sold for $567,782. Row/townhouse unit sales are up 3% 12 months to date. Row/townhouses have seen a 46% increase in days on market. Average days to sell is 38 days. Lot sales volume is down by 33%. Lot prices have decreased by 42%, 12 months to date. Average lot sale price: $427,865. FULL REPORT HERE. Parksville/Qualicum 18 single family homes sold. Average price: $933,603 (down 4% from 12 months to date, this year over last). Single-family unit sales volume is down 11%. Average days on market increased by 135% to 40 days. The average condo sold for $451,287. Condo unit sales are down 9%, 12 months to date. Condos have seen a 150% increase in days on market. Average days to sell is 40 days. The average row/townhouse sold for $672,043. Row/townhouse unit sales are down 8% 12 months to date. Row/townhouses have seen a 54% increase in days on market. Average days to sell is 34 days. Lot sales volume is down 36%. Lot prices have increased by 8%, 12 months to date. Average lot sale price: $660,620. FULL REPORT HERE. Cowichan Valley 26 single family homes sold. Average price: $786,935 (down 6% from 12 months to date, this year over last). Single-family unit sales volume is down 5%. Average days on market increased by 78% to 48 days. The average condo sold for $331,832. Condo unit sales are up 9%, 12 months to date. Condos have seen a 104% increase in days on market. Average days to sell is 53 days. The average row/townhouse sold for $564,572. Row/townhouse unit sales are up 9% 12 months to date. Row/townhouses have seen an 70% increase in days on market. Average days to sell is 51 days. Lot sales volume is down 13%. Lot prices have decreased by 29%, 12 months to date. Average lot sale price: $405,229. FULL REPORT HERE. *waterfront homes are not included in the monthly statistics IMPORTANT NOTICE: The BC Assessment Authority released its assessment values IMPORTANT NOTICE: The BC Assessment Authority released their assessment values today at www.bcassessment.caWatch this video for important context around what these values mean for homeowners and how to interpret this data for decision-making around your real estate holdings.BC Assessment values are the source of many wrong decisions that can cost homeowners a lot of money if not properly understood.Avoid the most common mistakes and save your valuable time by watching this video.If you are interested in comparing your home's market value to your BC Assessment value, reach out to me directly at 250.619.9207 or john@johncooper.caI provide accurate and complimentary home valuations to homeowners as part of my commitment to helping homeowners make intelligent decisions around their real estate holdings.I was trained as a real estate appraiser before I started as a real estate advisor and can provide valuations and analysis beyond what is typically offered and I love what I do. A Deep Dive with Mortgage Expert Damon Steele | Exploring the Trend of Parental Support for First-Time Buyers In Vancouver, the average first-time home buyer receives $180,000 from their parents according to a recent CBC news article. I sat down with mortgage expert Damon Steele to deep dive into the growing trend of parents contributing large amounts of money to their children's first home purchase. In this video, Damon covers the common concerns raised by parents and how he and his team of experts work to mitigate likely challenges before they arise. If you are considering helping your kids with a home purchase or are looking to start a conversation with your parents about this, then this video is for you. Your Essential Guide to Hiring the Perfect Real Estate Advisor! Follow this step by step guide to successfully hire a real estate advisor. Selling your home is a big deal and who you hire to help guide you through the process matters. In this video I outline the critical steps that will mitigate the likelihood of a poor experience. Just like any profession, who you work with matters and when it comes to what is likely one of your largest assets, it pays to proceed with care and due process. There are some common errors made by homeowners that are easily avoided. Watch this 3 minute video and set yourself up for success. 2023 Recap & 2024 Outlook - Navigating Investment Markets with Dave Leneveu Despite popular sentiment, 2023 was actually a very good year for the investment markets. What is in store for the investment markets in 2024? What went right and what went wrong in 2023? Understanding what is at stake in the investment markets is an important layer when making real estate decisions. In this video, local investment expert, Dave Leneveu of Rockmoor Wealth gives us a breakdown of what is in store for 2024. Enjoy. Strata Living: Navigating the Decision to Downsize with Confidence and Clarity Are you feeling pressure to "downsize" from your current home? Are you starting to feel overwhelmed by the exterior maintenance responsibilities? Are you getting tired of sorting and storing the piles of stuff you've accumulated over the years? Do you dislike the idea of paying monthly fees should you move into a condo or patio home? This is a conversation I am having weekly at the moment and I wanted to cover the most common objection holding people back from making an informed decision. In this video, I break down exactly what's included in strata fees in a typical condo, townhome, or patio home. If you have any questions about your current home's value and whether strata living is right for you, I am offering free consultations and assessments to anyone navigating this decision. No pressure, no hidden agenda just helpful guidance to assist you in the big decision ahead of you. This is not a decision to rush. Take your time, get informed and don't be afraid to ask for help. The Best Nanaimo Neighborhoods Let's talk about Nanaimo neighborhoods. What is the best neighborhood in our city? Is North Nanaimo the best? Are there areas that you should avoid completely? Restricting your search to specific areas is going to dramatically decrease your options, but no one wants to end up in a bad area. Let's talk about some common misconceptions and the mindset that is likely to set you up for success when navigating the Nanaimo real estate market. I have been helping people with their real estate decisions in Nanaimo for 16 years and this video covers my take on this complex and controversial topic.
Read MoreJohn Cooper’s 2023 Year In Review
The last few weeks' trading volume has slowed down significantly due to the holiday season which hopefully means that everybody is enjoying some downtime with their loved ones. As we approach the end of this year, I want to take a moment to reflect on the events and milestones that defined 2023. It's been a year of challenges, growth, and resilience. I'm grateful for the journey we've shared. Looking ahead to the new year, I'm excited to share my predictions and insights for what lies ahead. I'm eager to navigate it together in the coming year. As a reminder, I personally receive all email replies to this newsletter. If you are in need of some guidance around an upcoming real estate decision, I would love to hear from you. My purpose in building this real estate practice is to help people like you make intelligent decisions. I am here to help anyway I can and you will never feel any pressure to make a decision you dont feel 100 percent confident in. - John Cooper Notable Listings There are currently 249 active single family home listings in Nanaimo ranging in price from $429,900 for a 2 bed, 1 bath, 933 sqft South Nanaimo home located at 137 Strickland Ave, to a $3,975,000 for a 8 bed, 10 bath, 8499 sqft North Jingle Pot home located at 6045 Breonna Ave. I like to start by outlining the best value based on $/sqft. The 3 best value homes at present are 714 Bruce Ave a 7 bed, 3 bath, 5,713 sqft South Nanaimo home listed for $947,000 ($166/sqft), 1080 Nanaimo River Rd a 3 bed, 2 bath, 4,851 sqft Extension home listed for $998,000 ($206/sqft), & 54 Roberta Rd E a 3 bed, 3 bath, 2,747 sqft Chase River home listed for $599,900 ($218/sqft) The 3 homes currently on the market with the highest $/sqft are 351 Wesley St a 2 bed, 2 bath, 1,135 sqft Old City home listed for $1,799,000 ($1585/sqft), 7704 Clark Dr a 4 bed, 3 bath, 709 sqft Upper Lantzville home listed for $819,900 ($1156.sqft) & 2453 East Wellington Rd a 3 bed, 2 bath, 2,213 sqft Central Nanaimo home listed for $2,480,000 ($1121/sqft) Notable Sales There were 1,067 reported single-family home sales in Nanaimo in 2023. The 3 least expensive home sales were 431 Maple Street 1 bed, 1 bath, 1,008 sqft Brechin Hill home sold for $340,000, 1640 Cedar Rd a 4 bed, 1 bath, 1,015 sqft Cedar home sold for $360,000, & 1138 Woss Lake Dr. a 1 bed, 1 bath, 500 sqft South Jingle Pot home sold for $362,000. The 3 most expensive home sales were 3127 Northwood Rd a 5 bed, 7 bath, 9,000 sqft North Jingle Pot home sold for $3,345,000, 3410 Arrowsmith Rd a 4 bed, 5 bath, 5,338 sqft Departure Bay home sold for $2,913,000, & 3580 Bonnie Dr a 6 bed, 5 bath, 5,098 sqft Hammond Bay home sold for $2,450,000 The 3 highest $/sqft homes sold were 3280 DeCourcy Dr a 2 bed, 2 bath, 806 sqft Cedar home sold for $1,050,000 ($1303/sqft), 7181 Lantzville Rd a 2 bed, 1 bath, 1,037 sqft Lower Lantzville home sold for $1,125,000 ($1085/sqft) & 2910 Jameson Rd a 3 bed, 2 bath, 1,295 sqft North Jingle Pot home sold for $1,250,000 ($965/sqft) The 3 lowest $/sqft homes sold were 3010 Frost Rd a 4 bed, 2 bath, 3,108 sqft Extension home sold for $468,900 ($151/sqft), 2505 Glenayr Dr a 6 bed, 4 bath, 3,281 sqft Central Nanaimo home sold for $606,000 ($185/sqft) & 3614 Hillside Ave a 7 bed, 3 bath, 5,400 sqft Uplands home sold for $606,000 ($185/sqft) The 3 homes that sold the most above their asking price were 2911 Barnes Rd a 3 bed, 3 bath, 2,061 sqft Cedar home sold for $1,050,000 (24% over asking), 6424 Portsmouth Rd a 3 bed, 3 bath, 1,852 sqft North Nanaimo home sold for $752,000 ($22% over asking), & 1830 Haslam Rd a 4 bed, 3 bath, 2,768 sqft Cedar home sold for $711,750 (19% over asking price) The 3 homes that sold the most below their asking price were 1667 Extension Rd a 3 bed, 1 bath, 1,280 sqft Chase River home sold for $480,000 (40% below), 3365 Hallberg Rd a 4 bed, 2 bath, 2,040 sqft Extension home sold for $1,400,000 (30% below), 1100 Spruston Rd a 1 bed, 1 bath, 1,100 sqft Extension home sold for $1,400,000 (29% below) If you are looking for details on a recent sale not mentioned here, email me and I will send you the sale price. Guidance for Homeowners Selling in the Upcoming Year I speak regularly about the benefits of getting an early start in the year. In real estate, early spring starts in February and has a few clear benefits as opposed to waiting until April. Most notably, there is far less competition and the early spring has the maximum number of buyers entering the market. There is always an influx of listings in late spring that enter the market at a time when the pool of buyers has declined. The other primary advantage is that you are afforded a “second chance” to tune your listing ahead of late spring, armed with the market feedback from early spring to guide your strategic direction. If you have questions about the real estate market, I invite you to give me a call. I'm here to provide you with the information you need to make the right decision for your unique situation. In an industry sometimes plagued by what I call "Commission Breath," where agents might tell clients what they want to hear just to secure a listing, I take a different approach. My commitment is to give you both the good and the tough insights—the kind that helps you make an informed decision. Your satisfaction and confidence in your decision matter most to me. Guidance for Buyers in the Upcoming Year If you are considering entering the real estate market this year I want to share with you my 3 most important guiding principles. These are covered in our initial consultation in detail so this will give you a head start. Do not let anyone make you feel rushed or pressured. This is likely one of the biggest financial decisions you will ever make. You should feel supported in your decision to take your time and make a decision that is thoroughly evaluated and thought through. Do not spend more than you can afford for the long haul. Life happens and market conditions change. Whether it is mortgage rates or home prices, the people who win in real estate are the people who stay in control of their exit timing at all times. You need to be able to weather the storms that you don’t see coming and this is afforded by making responsible decisions when you purchase. Do not let anyone pressure you into buying outside of your comfort zone. Who you have at your side is critical. Buying a home is an emotionally charged decision and your advisor's job is to help you stay grounded in your decision making. A good advisor helps you organize your emotions and stay the course. Do not make the mistake of working with just anyone, do your research, and interview multiple agents. You should feel heard & understood and feel confident in your advisor at all times. Reply to this email and let's schedule a free consultation with me personally. In 25 minutes I will help you set you up for success with no obligation whatsoever to work with me. We can have the consultation over Zoom or in my office. I promise that you will leave the consultation with a much clearer picture of what the path to homeownership looks like, armed with an up-to-the-minute understanding of the current marketplace. Whether you’re looking for further clarification on the points and insights above, would like to discover your specific home value, or just have real estate questions you’d like answered, I’d love to hear from you!
Read MoreIsland Real Estate Trends and December 2023 Market Outlook
December 2023 Nanaimo Market Update December 2023 Nanaimo Single Family Home Real Estate Market Update. If you have specific questions about the Nanaimo Real Estate Market, including Ladysmith, Parksville & Qualicum Beach, I am available to help. I am available to meet with you in person or on the phone and I can help you with your real estate decisions. My goal is to provide you with guidance to assist you in making a decision you can be proud of and get you from where you are now, to where you want to be. No pressure, no sales tactics and scripts just patient and caring advice rooted in your best interests.To watch the October 2023 Market Update, click the video window below! Most Recent Market Statistics (November 2023)* Vancouver Island (not including Victoria) 236 single family homes sold. Average price: $792,067 (down 7% from 12 months to date, this year over last). Single-family unit sales volume is down 7%. Average days on market increased by 70% to 46 days. The average condo sold for $408,329. Condo unit sales are down 11%, 12 months to date. Condos have seen a 66% increase in days on market. Average days to sell is 48 days. The average row/townhouse sold for $570,210. Row/townhouse unit sales are down 2% 12 months to date. Row/townhouses have seen a 61% increase in days on market. Average days to sell is 45 days. Lot sales volume is down 25%. Lot prices have decreased by 19%, 12 months to date. Average lot sale price: $446,317. FULL REPORT HERE. Nanaimo 63 single family homes sold. Average price: $820,693 (down 8% 12 months to date, this year over last). Single family unit sales volume is down 10%. Average days on market has increased by 64% to 36 days. The average condo sold for $438,916. Condo unit sales are down 17%, 12 months to date. Condos have seen a 81% increase in days on market. Average days to sell is 38 days. The average row/townhouse sold for $563,016. Row/townhouse unit sales are down 1% 12 months to date. Row/townhouses have seen a 52% increase in days on market. Average days to sell is 38 days. Lot sales volume is down by 38%. Lot prices have decreased by 45%, 12 months to date. Average lot sale price: $427,865. FULL REPORT HERE. Parksville/Qualicum 35 single family homes sold. Average price: $928,672 (down 5% from 12 months to date, this year over last). Single-family unit sales volume is down 9%. Average days on market increased by 61% to 37 days. The average condo sold for $440,990. Condo unit sales are down 13%, 12 months to date. Condos have seen a 150% increase in days on market. Average days to sell is 40 days. The average row/townhouse sold for $656,006. Row/townhouse unit sales are down 8% 12 months to date. Row/townhouses have seen a 67% increase in days on market. Average days to sell is 35 days. Lot sales volume is down 49%. Lot prices have decreased by 17%, 12 months to date. Average lot sale price: $670,296. FULL REPORT HERE. Cowichan Valley 42 single family homes sold. Average price: $785,666 (down 6% from 12 months to date, this year over last). Single-family unit sales volume is down 5%. Average days on market increased by 88% to 49 days. The average condo sold for $335,383. Condo unit sales are up 1%, 12 months to date. Condos have seen a 135% increase in days on market. Average days to sell is 54 days. The average row/townhouse sold for $563,252. Row/townhouse unit sales are up 1% 12 months to date. Row/townhouses have seen an 89% increase in days on market. Average days to sell is 51 days. Lot sales volume is down 20%. Lot prices have decreased by 31%, 12 months to date. Average lot sale price: $392,841. FULL REPORT HERE. *waterfront homes are not included in the monthly statistics
Read MoreIsland Real Estate Trends and November 2023 Market Outlook
November 2023 With Less than 8 weeks remaining in 2023, it is a perfect time to define your real estate plan for 2024. Presently interest rates are holding steady and the industry is reasonably optimistic that this will hold into Q1 2024. Are prices going to start rising in 2024? My instincts suggest no, they will not. Is the bottom going to fall out of this market with buyers gaining substantial negotiating leverage and massive discounts? My instincts suggest no, they will not. In order for prices to rise we would need to see a dramatic increase in sales. An absolute necessity of this type of demand is access to inexpensive capital which is not in the forecast. Conversely, for prices to decline, there would need to be an equally dramatic increase in inventory. You are probably asking yourself, why has inventory not increased despite the challenging lending climate? I believe it is because when a homeowner moves, it will often trigger a mortgage requalification. This can be a time-consuming and unpredictable process. Particularly during a period when Canadians are carrying unprecedented levels of household debt. Additionally, appraisal values are inconsistent during market shifts like the one we are experiencing now. Although this market poses challenges for both buyers and sellers, it could be much worse. As an Islander, I consider ourselves lucky, not just because we get to live in the nicest region on planet earth, but because we have lifestyle demand that is economically agnostic, meaning, regardless of what is going on economically there are people all over the planet are willing to make an effort and take a risk to call this place home. If you have a real estate decision in front of you or want to plan ahead to mitigate your risk exposure, call me. I am happy to talk to you about it. No sales pressure. No tactics. Just helpful guidance to move you forward. Reach out anytime and for any reason.John Cooper250.619.9207john@coopergroup.ca October 2023 Nanaimo Market Update As we all know, making informed decisions starts with having access to accurate information. Therefore, I am pleased to present the Nanaimo Real Estate Market Update for November 2023. This update offers a comprehensive snapshot of the current market conditions, and I invite you to watch the video to gain valuable insights.If you have any questions or require further information, please do not hesitate to reach out. As always, I am here to provide my insights and help you make informed decisions in the Nanaimo real estate market!To watch the October 2023 Market Update, click the video window below! Most Recent Market Statistics (October 2023)* Vancouver Island (not including Victoria) 244 single family homes sold. Average price: $789,341 (down 7% from 12 months to date, this year over last). Single-family unit sales volume is down 9%. Average days on market increased by 77% to 46 days. The average condo sold for $407,729. Condo unit sales are down16%, 12 months to date. Condos have seen a 66% increase in days on market. Average days to sell is 48 days. The average row/townhouse sold for $568,474. Row/townhouse unit sales are down 8% 12 months to date. Row/townhouses have seen a 67% increase in days on market. Average days to sell is 45 days. Lot sales volume is down 31%. Lot prices have decreased by 21%, 12 months to date. Average lot sale price: $437,422. FULL REPORT HERE. Nanaimo 67 single family homes sold. Average price: $818,228 (down 9% 12 months to date, this year over last). Single family unit sales volume is down 14%. Average days on market has increased by 71% to 36 days. The average condo sold for $437,519. Condo unit sales are down 22%, 12 months to date. Condos have seen a 90% increase in days on market. Average days to sell is 38 days. The average row/townhouse sold for $562,464. Row/townhouse unit sales are down 10% 12 months to date. Row/townhouses have seen a 73% increase in days on market. Average days to sell is 38 days. Lot sales volume is down by 54%. Lot prices have decreased by 40%, 12 months to date. Average lot sale price: $436,854. FULL REPORT HERE. Parksville/Qualicum 37 single family homes sold. Average price: $920,255 (down 6% 12 months to date, this year over last). Single family unit sales volume is down by 7%. Average days on market increased by 90% to 38 days. The average condo sold for $438,252. Condo unit sales are down 19%, 12 months to date. Condos have seen a 233% increase in days on market. Average days to sell is 40 days. The average row/townhouse sold for $658,763. Row/townhouse unit sales are down 14% 12 months to date. Row/townhouses have seen a 100% increase in days on market. Average days to sell is 36 days. Lot sales volume is down by 57%. Lot prices have increased by 5%, 12 months to date. Average lot sale price: $608,916. FULL REPORT HERE. Cowichan Valley 36 single family homes sold. Average price: $781,526 (down 7% from 12 months to date, this year over last). Single-family unit sales volume is down 7%. Average days on market increased by 96% to 49 days. The average condo sold for $333,263. Condo unit sales are down 6%, 12 months to date. Condos have seen a 140% increase in days on market. Average days to sell is 53 days. The average row/townhouse sold for $559,548. Row/townhouse unit sales are down 6% 12 months to date. Row/townhouses have seen an 85% increase in days on market. Average days to sell is 50 days. Lot sales volume is down 28%. Lot prices have decreased by 28%, 12 months to date. Average lot sale price: $403,470. FULL REPORT HERE. *waterfront homes are not included in the monthly statistics
Read MoreIsland Real Estate Trends and October 2023 Market Outlook
October 2023 "The times they are a-changin'" - Bob Dylan It would appear that we need to come to grips with a new world of higher interest rates. The real estate investors of the 80’s and 90’s warned us that these days could come and encouraged caution with their “cash is king” mantra of the day. As I peer into my real estate crystal ball, I am starting to deduce that the current rate environment is here to stay for a while. The hope of a quick correction back to rates under 3% does not seem to be materializing. Be cautious when those who stand to gain from a prediction are the ones championing it. Their vision is clouded with the optimism that comes with no plan B. Despite the challenges that this trend poses for islanders, we are in better shape than the rest of Canada. ‘Baby Boomers’ control the bulk of the real estate wealth in Canada, and it is clear that ‘Boomers’ like what our island lifestyle offers. This movement of wealth to the sunny shores of Vancouver Island will mitigate the impact that higher rates are having on the overall Canadian market. If you have an important real estate decision in front of you, I can help you with your plan with a free, no-obligation, consultation. - John Cooper October 2023 Nanaimo Market Update As we all know, making informed decisions starts with having access to accurate information. Therefore, I am pleased to present the Nanaimo Real Estate Market Update for October 2023. This update offers a comprehensive snapshot of the current market conditions, and I invite you to watch the video to gain valuable insights.If you have any questions or require further information, please do not hesitate to reach out. As always, I am here to provide my insights and help you make informed decisions in the Nanaimo real estate market!To watch the October 2023 Market Update, click the video window below! Most Recent Market Statistics (September 2023)* Vancouver Island (not including Victoria) 266 single family homes sold. Average price: $785,681 (down 8% from 12 months to date, this year over last). Single-family unit sales volume is down 12%. Average days on market increased by 92% to 46 days. The average condo sold for $408,096. Condo unit sales are down 24%, 12 months to date. Condos have seen a 72% increase in days on market. Average days to sell is 48 days. The average row/townhouse sold for $564,752. Row/townhouse unit sales are down 12% 12 months to date. Row/townhouses have seen a 73% increase in days on market. Average days to sell is 45 days. Lot sales volume is down 35%. Lot prices have decreased by 20%, 12 months to date. Average lot sale price: $441,297. FULL REPORT HERE. Nanaimo 85 single family homes sold. Average price: $813,695 (down 10% 12 months to date, this year over last). Single family unit sales volume is down 15%. Average days on market has increased by 80% to 36 days. The average condo sold for $436,933. Condo unit sales are down 28%, 12 months to date. Condos have seen a 86% increase in days on market. Average days to sell is 39 days. The average row/townhouse sold for $559,094. Row/townhouse unit sales are down 12% 12 months to date. Row/townhouses have seen a 95% increase in days on market. Average days to sell is 39 days. Lot sales volume is down by 51%. Lot prices have decreased by 39%, 12 months to date. Average lot sale price: $465,314. FULL REPORT HERE. Parksville/Qualicum 33 single family homes sold. Average price: $920,492 (down 6% 12 months to date, this year over last). Single family unit sales volume is down by 9%. Average days on market increased by 135% to 40 days. The average condo sold for $445,142. Condo unit sales are down 30%, 12 months to date. Condos have seen a 160% increase in days on market. Average days to sell is 39 days. The average row/townhouse sold for $661,539. Row/townhouse unit sales are down 22% 12 months to date. Row/townhouses have seen a 100% increase in days on market. Average days to sell is 34 days. Lot sales volume is down by 65%. Lot prices have increased by 13%, 12 months to date. Average lot sale price: $644,086. FULL REPORT HERE. Cowichan Valley 45 single family homes sold. Average price: $783,024 (down 7% from 12 months to date, this year over last). Single-family unit sales volume is down 10%. Average days on market increased by 113% to 49 days. The average condo sold for $334,647. Condo unit sales are down 6%, 12 months to date. Condos have seen a 224% increase in days on market. Average days to sell is 55 days. The average row/townhouse sold for $554,487. Row/townhouse unit sales are down 0.5% 12 months to date. Row/townhouses have seen an 78% increase in days on market. Average days to sell is 48 days. Lot sales volume is down 36%. Lot prices have decreased by 25%, 12 months to date. Average lot sale price: $407,874. FULL REPORT HERE. *waterfront homes are not included in the monthly statistics
Read MoreNanaimo Real Estate Market Update - September 2023
September 2023 As of today, I am officially a parent of 2 high school students. The excitement is real, as my 2 girls get prepared for their introduction to school. Just like my girls getting ready for school, many of my clients are getting ready to take action during this fall market. This is the best time to be making a move since 2018. Balanced market conditions are conducive to successful moves as buyers and sellers have equal leverage in negotiations and fair outcomes are easier to come by. The last few years have only been favourable to developers, flippers and anyone cashing out. The market we are in now is ideal for owner-occupiers who want to make calculated moves that mitigate their risk of hasty or high-pressure decisions. You do not have to look very far right now to find examples of people who were pressured into purchase decisions that they regret by overly optimistic advisors willing to ignore the warning signals from the market. Seeking qualified guidance is one of the most important objectives of anyone making a high-value real estate decision.- John Cooper September 2023 Nanaimo Market Update As we all know, making informed decisions starts with having access to accurate information. Therefore, I am pleased to present the Nanaimo Real Estate Market Update for September 2023. This update offers a comprehensive snapshot of the current market conditions, and I invite you to watch the video to gain valuable insights.If you have any questions or require further information, please do not hesitate to reach out. As always, I am here to provide my insights and help you make informed decisions in the Nanaimo real estate market!To watch the September 2023 Market Update, click the video window below! Most Recent Market Statistics (August 2023)* Vancouver Island (not including Victoria) 324 single family homes sold. Average price: $785,566 (down 7% from 12 months to date, this year over last). Single-family unit sales volume is down 17%. Average days on market increased by 100% to 46 days. The average condo sold for $409,006. Condo unit sales are down 31%, 12 months to date. Condos have seen a 71% increase in days on market. Average days to sell is 48 days. The average row/townhouse sold for $563,297. Row/townhouse unit sales are down 18% 12 months to date. Row/townhouses have seen a 73% increase in days on market. Average days to sell is 45 days. Lot sales volume is down 38%. Lot prices have decreased by 21%, 12 months to date. Average lot sale price: $434,714. FULL REPORT HERE. Nanaimo 83 single family homes sold. Average price: $814,367 (down 10% 12 months to date, this year over last). Single family unit sales volume is down 23%. Average days on market has increased by 95% to 37 days. The average condo sold for $433,256. Condo unit sales are down 35%, 12 months to date. Condos have seen a 95% increase in days on market. Average days to sell is 39 days. The average row/townhouse sold for $555,867. Row/townhouse unit sales are down 19% 12 months to date. Row/townhouses have seen a 105% increase in days on market. Average days to sell is 39 days. Lot sales volume is down by 53%. Lot prices have decreased by 38%, 12 months to date. Average lot sale price: $429,875. FULL REPORT HERE. Parksville/Qualicum 57 single family homes sold. Average price: $924,685 (down 5% 12 months to date, this year over last). Single family unit sales volume is down by 10%. Average days on market increased by 135% to 40 days. The average condo sold for $439,983. Condo unit sales are down 32%, 12 months to date. Condos have seen a 129% increase in days on market. Average days to sell is 39 days. The average row/townhouse sold for $652,197. Row/townhouse unit sales are down 21% 12 months to date. Row/townhouses have seen a 106% increase in days on market. Average days to sell is 35 days. Lot sales volume is down by 62%. Lot prices have increased by 17%, 12 months to date. Average lot sale price: $654,016. FULL REPORT HERE. Cowichan Valley 63 single family homes sold. Average price: $781,325 (down 7% from 12 months to date, this year over last). Single-family unit sales volume is down 13%. Average days on market increased by 123% to 49 days. The average condo sold for $334,273. Condo unit sales are down 15%, 12 months to date. Condos have seen a 224%% increase in days on market. Average days to sell is 55 days. The average row/townhouse sold for $552,014. Row/townhouse unit sales are down 9% 12 months to date. Row/townhouses have seen an 104% increase in days on market. Average days to sell is 49 days. Lot sales volume is down 36%. Lot prices have decreased by 24%, 12 months to date. Average lot sale price: $407,822. FULL REPORT HERE. *waterfront homes are not included in the monthly statistics Is Strata/Condo Ownership Right for You? Click below to watch the video! Are Home Prices Stable on Vancouver Island? Learn More! Click below to watch the video!
Read MoreNanaimo Real Estate Market Update - August 2023
August 2023 Don’t fall victim to the FOMO anxiety that is all too common when August hits and translate that stress to action and get out there and enjoy our island! As the sun continues to grace us with its warmth, the real estate landscape remains equally vibrant. The trends we've witnessed over the past months seem poised to keep most of their momentum, creating an opportune environment for both buyers and sellers. While temperatures might be high, there's a sense that this sizzling market might be accompanied by a touch of cooling in the coming months. As we embrace the latter part of the year, it's reasonable to anticipate a gentle ebb in the pace of the Vancouver Island real estate market. The shifts appear to be gradual, hinting at a market that's transitioning towards long-term stability rather than abrupt change. It's a time to evaluate your goals and aspirations and to plan wisely for your future in real estate. I'm committed to providing you with insightful data and guidance untainted by pushy sales tactics, so feel free to connect with me for any assistance you may need on your real estate journey. I am here to help. - John Cooper August 2023 Nanaimo Market Update As we all know, making informed decisions starts with having access to accurate information. Therefore, I am pleased to present the Nanaimo Real Estate Market Update for August 2023. This update offers a comprehensive snapshot of the current market conditions, and I invite you to watch the video to gain valuable insights.If you have any questions or require further information, please do not hesitate to reach out. As always, I am here to provide my insights and help you make informed decisions in the Nanaimo real estate market!To watch the August 2023 Market Update, click the video window below! Most Recent Market Statistics (July 2023)* Vancouver Island (not including Victoria) 414 single family homes sold. Average price: $786,861 (down 6% from 12 months to date, this year over last). Single-family unit sales volume is down 20%. Average days on market increased by 100% to 46 days. The average condo sold for $405,677. Condo unit sales are down 34%, 12 months to date. Condos have seen a 68% increase in days on market. Average days to sell is 47 days. The average row/townhouse sold for $559,198. Row/townhouse unit sales are down 24% 12 months to date. Row/townhouses have seen a 76% increase in days on market. Average days to sell is 44 days. Lot sales volume is down 41%. Lot prices have decreased by 23%, 12 months to date. Average lot sale price: $425,632 FULL REPORT HERE. Nanaimo112 single family homes sold. Average price: $814,848 (down 9% 12 months to date, this year over last). Single family unit sales volume is down 28%. Average days on market has increased by 106% to 37 days. The average condo sold for $435,006. Condo unit sales are down 39%, 12 months to date. Condos have seen a 95% increase in days on market. Average days to sell is 37 days. The average row/townhouse sold for $551,244. Row/townhouse unit sales are down 26% 12 months to date. Row/townhouses have seen a 100% increase in days on market. Average days to sell is 38 days. Lot sales volume is down by 57%. Lot prices have decreased by 38%, 12 months to date. Average lot sale price: $473,967. FULL REPORT HERE. Parksville/Qualicum 50 single family homes sold. Average price: $923,640 (down 5% 12 months to date, this year over last). Single family unit sales volume is down by 15%. Average days on market increased by 144% to 39 days. The average condo sold for $415,427. Condo unit sales are down 34%, 12 months to date. Condos have seen a 129% increase in days on market. Average days to sell is 39 days. The average row/townhouse sold for $639,689. Row/townhouse unit sales are down 17% 12 months to date. Row/townhouses have seen a 140% increase in days on market. Average days to sell is 36 days. Lot sales volume is down by 70%. Lot prices have increased by 9%, 12 months to date. Average lot sale price: $584,736. FULL REPORT HERE. Cowichan Valley88 single family homes sold. Average price: $778,107 (down 7% from 12 months to date, this year over last). Single-family unit sales volume is down 15%. Average days on market increased by 133% to 49 days. The average condo sold for $335,738. Condo unit sales are down 20%, 12 months to date. Condos have seen a 244%% increase in days on market. Average days to sell is 55 days. The average row/townhouse sold for $549,249. Row/townhouse unit sales are down 20% 12 months to date. Row/townhouses have seen an 117% increase in days on market. Average days to sell is 50 days. Lot sales volume is down 20%. Lot prices have decreased by 28%, 12 months to date. Average lot sale price: $402,844. FULL REPORT HERE. *waterfront homes are not included in the monthly statistics Building A Custom Home VS. Buying An Existing Home Click below to watch the video! Due Diligence Is Back In Real Estate! Click below to watch the video! Please reach out with any questions you may have! Enjoy the rest of your summer on beautiful Vancouver Island! Warmest of regards, John Cooper John Cooper Group - eXp Realty john@coopergoup.ca 250.619.9207 Contact Me Now
Read MoreNanaimo Real Estate Market Update - July 2023
July 2023 It's getting hot in here! The hot weather has arrived right alongside the hot market. That being said, I believe this weather might remain hotter for longer than the market. June was busy as sellers raced to take advantage of the spring market, and buyers raced to secure a home before the next interest rate hike. As we enter the second half of 2023, I expect the Vancouver Island real estate market to slow down marginally into 2024. I predict a slow but healthy market that will last into 2024 and beyond. I am optimistically forecasting our market to slow down but not crash. Values will hold but not escalate. Supply and demand will remain balanced. This is a good time to make plans and set a path for your ideal envisioned future. I am here to help you fill your plans with accurate data, free from manipulative sales tactics. If you require that kind of assistance, please reach out anytime and for any reason. - John Cooper July 2023 Nanaimo Market Update As we all know, making informed decisions starts with having access to accurate information. Therefore, I am pleased to present the Nanaimo Real Estate Market Update for July 2023. This update offers a comprehensive snapshot of the current market conditions, and I invite you to watch the video to gain valuable insights.If you have any questions or require further information, please do not hesitate to reach out. As always, I am here to provide my insights and help you make informed decisions in the Nanaimo real estate market!To watch the July 2023 Market Update, click the video window below! Most Recent Market Statistics (June 2023)* Vancouver Island (not including Victoria) 424 single-family homes sold. Average price: $788,743 (down 5% from 12 months to date, this year over last). Single-family unit sales volume is down 25%. Average days on market increased by 96% to 45 days. The average condo sold for $405,056. Condo unit sales are down 38%, 12 months to date. Condos have seen a 55% increase in days on market. Average days to sell is 45 days. The average row/townhouse sold for $559,064. Row/townhouse unit sales are down 30% 12 months to date. Row/townhouses have seen a 80% increase in days on market. Average days to sell is 45 days. Lot sales volume is down 51%. Lot prices have decreased by 19%, 12 months to date. Average lot sale price: $429,910. FULL REPORT HERE. Nanaimo117 single-family homes sold. Average price: $818,056 (down 7% 12 months to date, this year over last). Single-family unit sales volume is down 33%. Average days on market has increased by 106% to 37 days. The average condo sold for $431,888. Condo unit sales are down 40%, 12 months to date. Condos have seen a 85% increase in days on market. Average days to sell is 37 days. The average row/townhouse sold for $547,366. Row/townhouse unit sales are down 37% 12 months to date. Row/townhouses have seen a 105% increase in days on market. Average days to sell is 39 days. Lot sales volume is down by 60%. Lot prices have decreased by 32%, 12 months to date. Average lot sale price: $498,942. FULL REPORT HERE. Parksville/Qualicum 61 single-family homes sold. Average price: $916,663 (down 4% 12 months to date, this year over last). Single-family unit sales volume is down by 14%. Average days on market increased by 138% to 38 days. The average condo sold for $415,289. Condo unit sales are down 34%, 12 months to date. Condos have seen a 39% increase in days on market. Average days to sell is 32 days. The average row/townhouse sold for $636,615. Row/townhouse unit sales are down 22% 12 months to date. Row/townhouses have seen a 140% increase in days on market. Average days to sell is 36 days. Lot sales volume is down by 79%. Lot prices have increased by 12%, 12 months to date. Average lot sale price: $559,295. FULL REPORT HERE. Cowichan Valley88 single-family homes sold. Average price: $780,585 (down 6% from 12 months to date, this year over last). Single-family unit sales volume is down 21%. Average days on market increased by 135% to 51 days. The average condo sold for $336,687. Condo unit sales are down 28%, 12 months to date. Condos have seen a 218%% increase in days on market. Average days to sell is 47 days. The average row/townhouse sold for $556,510. Row/townhouse unit sales are down 26% 12 months to date. Row/townhouses have seen a 113% increase in days on market. Average days to sell is 49 days. Lot sales volume is down 31%. Lot prices have decreased by 27%, 12 months to date. Average lot sale price: $408,263. FULL REPORT HERE. *waterfront homes are not included in the monthly statistics Copyright © 2023 John Cooper Group - eXp Realty, All rights reserved.eXp Realty
Read MoreNanaimo Real Estate Market Update - June 2023
June 2023 “Balanced market conditions that slightly favour sellers”. In one sentence, that is what's going on in the Vancouver Island real estate market. Accurate information is the most important ingredient for success in this sensitive market. Clearly and confidently understanding when the best time to introduce your home to the market is, and precisely what the price should be is not a decision to guess at. Getting it right in June can be the difference between selling inside of 2023 or waiting or the market to return in 2024. June is a critical success month for buyers, sellers, and agents. I love this time of year. June is so special to me that I named my youngest daughter after this month. Sure, it was one of the only names we agreed on, but a special month to me nevertheless. June brings the excitement of summer to our senses and encourages us to dream about a future filled with nature's warmth and time with family and friends. June is also one of the busiest months of the year for real estate advisors. Many agents will earn over 40% of their annual income in the months of May and June. I hope to see you out in the wild on our wonderful island in 2023. - John Cooper, Personal Real Estate Corporation 250-619-9207 john@coopergroup.ca June 2023 Nanaimo Market Update As we all know, making informed decisions starts with having access to accurate information. Therefore, I am pleased to present the Nanaimo Real Estate Market Update for June 2023. This update offers a comprehensive snapshot of the current market conditions, and I invite you to watch the video to gain valuable insights.If you have any questions or require further information, please do not hesitate to reach out. As always, I am here to provide my insights and help you make informed decisions in the Nanaimo real estate market!To watch the June 2023 Market Update, click the video window below! Most Recent Market Statistics (May 2023)* Vancouver Island (not including Victoria) 488 single-family homes sold. Average price: $790,245 (down 4% from 12 months to date, this year over last). Single-family unit sales volume is down 27%. Average days on the market increased by 100% to 44 days. The average condo sold for $405,213. Condo unit sales are down 43%, 12 months to date. Condos have seen a 40% increase in days on the market. Average days to sell is 42 days. The average row/townhouse sold for $561,988. Row/townhouse unit sales are down 34% 12 months to date. Row/townhouses have seen a 65% increase in days on the market. Average days to sell is 43 days. Lot sales volume is down 58%. Lot prices have decreased by 17%, 12 months to date. Average lot sale price: $432,994.FULL REPORT HERE. Nanaimo116 single-family homes sold. Average price: $818,762 (down 6% 12 months to date, this year over last). Single-family unit sales volume is down 34%. Average days on the market have increased by 100% to 36 days. The average condo sold for $432,945. Condo unit sales are down 47%, 12 months to date. Condos have seen a 71% increase in days on the market. Average days to sell is 36 days. The average row/townhouse sold for $551,228. Row/townhouse unit sales are down 46% 12 months to date. Row/townhouses have seen a 111% increase in days on the market. Average days to sell is 40 days. Lot sales volume is down by 62%. Lot prices have decreased by 35%, 12 months to date. Average lot sale price: $498,757. FULL REPORT HERE. Parksville/Qualicum 70 single-family homes sold. Average price: $913,550 (down 4% 12 months to date, this year over last). Single-family unit sales volume is down by 15%. Average days on the market increased by 164% to 37 days. The average condo sold for $420,729. Condo unit sales are down 39%, 12 months to date. Condos have seen a 15% increase in days on the market. The average days to sell is 30 days. The average row/townhouse sold for $649,392. Row/townhouse unit sales are down 17% 12 months to date. Row/townhouses have seen a 129% increase in days on the market. Average days to sell is 32 days. Lot sales volume is down by 79%. Lot prices have increased by 5%, 12 months to date. Average lot sale price: $533,977. FULL REPORT HERE. Cowichan Valley86 single-family homes sold. Average price: $778,069 (down 5% from 12 months to date, this year over last). Single-family unit sales volume is down 27%. Average days on the market increased by 125% to 45 days. The average condo sold for $348,267. Condo unit sales are down 28%, 12 months to date. Condos have seen a 194% increase in days on market. Average days to sell is 47 days. The average row/townhouse sold for $574,596. Row/townhouse unit sales are down 30% 12 months to date. Row/townhouses have seen an 88% increase in days on market. Average days to sell is 45 days. Lot sales volume is down 43%. Lot prices have decreased by 22%, 12 months to date. Average lot sale price: $550,442. FULL REPORT HERE. *waterfront homes are not included in the monthly statistics Knowing Your Specific Market Is Critical In Making A Wise Negotiating Decision Click below to watch the video! Hot Topic: Housing Affordability on Vancouver Island Click below to watch the video! JCG Summer Event 📢
Read MoreMonthly Market Update - May 2023
May 2023 We are smack dab in the middle of the busiest time of year for real estate trading on Vancouver Island. The busiest months for real estate trading are May, June, April, September, & October (in that order). Mid May represents the middle of the spring market. 2023 has seen our local real estate market return to balanced market conditions. In the last 6 months we have seen 64 Single Family Homes with at least 3 bedrooms and 2 bathrooms sell every month. There are presently 249 homes in Nanaimo with at least 3 bedrooms and 2 bathrooms. This represents 3.89 months of inventory. This confirms that we are in balanced market conditions, slightly favouring sellers. It is my prediction that these balanced conditions will extend at least until August. As we approach fall I will be reporting on market conditions, I am expecting the market will start to see inventory rise by late 2023. Stay tuned to our weekly reports for my real time predictions. If you are interested in my analysis of your specific property, just reply to this email with your address and I will do a custom market analysis for our property type to confirm if you are in a Sellers Market, Buyers Market or Balanced Market. The math is different for every property type. - John Cooper Story Time: It's Never Too Early To Plan Ahead With Your Real Estate Decisions. Click below to watch the video! Is An Online Home Evaluation Tool Accurate? Click below to watch the video! What Are The Major Benefits Of An Open House Done 'Correctly'? Click below to watch the video! Copyright © 2023 John Cooper Group - eXp Realty, All rights reserved.
Read More